

🗞 Weekly Market Newsletter | Edition No. 35
Major News Update + A Full Analysis of Major Indices Including Stocks, Crypto, Commodities, Bonds & Forex

Monday Morning ☀️, March 20th, 2023
Hello Friends,
I want to take a moment and remind all of you of a very famous headline newspaper from 2008, please see below.


The headline "Chancellor on brink of second bailout for Banks" may ring a bell to you, as it was inscribed into Bitcoin's genesis block by the anonymous creator Satoshi Nakamoto when the network was created.
(I've wrote about this in great detail in my course, Episode One of A Journey from Barter to Bits - The Origin of Money and Blockchain + The Crypto Opportunity.)
Fast forward 14 years and it seems like Satoshi's ultimate end game may be playing out in real time.
Since the pandemic of 2020, inflation has skyrocketed upwards of 6-9% in the West, and even more in other parts of the world. Central Banks have been left with no choice but to increase the money supply, which ultimately devalues the purchasing power of our cash.
But is our money safe with banks?
Recent bank runs have triggered liquidity crises, from Silicon Valley Bank to Credit Suisse, a 167-year-old institution that collapsed over the weekend and required a buyout by UBS at a fraction of its market cap.
Why are these banks now insolvent? Because in part, they technically always are.
The fractional reserve banking system, which allows banks to lend out nearly 100% of our deposits to earn a profit, is a risk management system that smells like eventual disaster.
And it seems like we're experiencing that now.
People have been asking me about the sudden liquidity crunch for banks, and it's because the "safe" investments (U.S Debt aka. Treasuries) they chose to park capital (our money) experienced tremendous losses.
Those losses come from the balances you see when you log into online banking - it's your money that they lost.


Now, they must ask the government to step in and fix their mistake.
But the bigger problem is the U.S. government debt that these institutions have parked their capital in - is rapidly losing value.
If the government doesn't intervene, banks that are experiencing more outflows than inflows will have to sell their investments at a loss, creating a domino effect that threatens the stability of the U.S. government's position of power with the U.S. Dollar.
We're at a critical moment this week as we await the Federal Reserve's decision on interest rates.
This decision will heavily influence how investors perceive risk in the coming months.
If the Fed pauses on raising rates, investors may perceive this as a signal that the Fed is halting its efforts to combat inflation, ultimately creating a bullish outlook for non-cash investments, such as risk assets.
On the other hand, a 25bps or 50bps hike may be considered as status quo, but it may appear as a dovish stance from Fed Chairman J. Powell, who has been the economic leader for the past 18 months. However, the Fed risks putting extreme pressure on the bond market with such hikes, and we may witness a domino effect of bank failures that could trigger the economic doom many have been warning us about.
Therefore, I assume the higher end of the rate hike scale very unlikely.
This window provides an opportunity for cryptocurrencies to take center stage and demonstrate their value in the world.
While regulations in the West may have been slow to materialize, this could be the narrative that propels crypto into mainstream adoption or usher in a new wave of capital.
As a digital asset investor, it would be wise to prepare for the wave to arrive by ensuring that wallets and portfolios are ready to take profits when they come.
However, I must caution you as the financial and political system is still very fragile, these asset appreciations may only be short-lived, pending more stability in the global system.
Have a plan ready for your portfolio.
Stay solvent, sending you the best of fortune,
- Matthew Fox
📰 Fox MetaCapital’s Weekly News Recap
You may press the 🗞 to read more about each headline.
Major News + Crypto Headlines
🗞 Credit Suisse, 167 Year Old Major Investment Bank, Folds (Bailout Alert)
💭 Matthew’s Thoughts…
The facts;
Credit Suisse, one of the largest banks in the world, has been bought out by UBS, another Swiss bank, after concerns of a global banking crisis.
Credit Suisse was forced to borrow $54 billion from the Swiss central bank to maintain its finances.
Its largest shareholders included the Saudi National Bank, Qatari state-owned investment bank Qatar Holding LLC, Saudi investment vehicle Olayan Group, and global investment giant BlackRock. These shareholders were not consulted on the takeover as it was pushed through by the Swiss government.

Credit Suisse, among the 30 international banks considered too big to fail, was hit by some of the shockwaves emanating from the SVB collapse. The bank's share price fell significantly as investors were spooked by weaknesses in its operations.
In response, Credit Suisse had to borrow $54 billion from the Swiss central bank to shore up its finances.
Again, we see evidence of the Government stepping in which raises the question, are we on the brink of migrating from capitalism to socialism?
How far will the government be required to subsidize the risks banks take?
Heading into this week, the buyout of Credit Suisse by UBS has raised concerns about the health of the global financial system.
The collapse of SVB and subsequent fall in investor confidence has threatened the stability of other major banks.
The potential for more bank failures, triggered by losses on safe investments, could create a domino effect, leading to a global banking crisis.
The health of the banking system is a critical component of the economy as a whole, and the current uncertainties in the banking sector could lead to significant economic instability.
Will crypto save traditional finance? We need a hero.
🗞 Last Weeks Data: CPI as Expected; PPI below Estimates - Economy is Cooling.
💭 Matthew’s Thoughts…
On the economic front - last weeks CPI (Consumer Price Index) numbers came in as expected ~6%, while PPI (Producer Price Index) was under estimates.
The economy is for certain, cooling.
For those of you who may not be familiar, the CPI measures the average change in prices that consumers pay for goods and services over time, while the PPI measures the average change in prices that producers receive for the goods and services they provide.
When both indices show a decrease, it's generally a sign that inflationary pressures are easing up.
What does this mean for us and for the economy as a whole?
Well, it could potentially impact decisions made by the Federal Reserve this upcoming week when it comes to interest rates. If the economy is cooling down and inflationary pressures are easing, the Fed may decide to hold off on raising interest rates in the near future.
🗞 Global Central Banks Panic Re: Liquidity, Form Pact on Sunday.
💭 Matthew’s Thoughts…
Over the weekend an emergency meeting was held amongst many of the world’s leading central banks to form a liquidity pact to limit any contagion from the Credit Suisse fall-out.

Let's break down what this recent banking news actually means.
Imagine banks as friends running lemonade stands, each using different types of money.
If one friend doesn't have enough money for lemons and sugar, everyone gets worried.
To avoid any potential problems, the friends (banks) decide to create a plan. If anyone runs out of their own money, they can borrow from a friend who uses US dollars.
This keeps the lemonade stands (or banks) running smoothly.
This plan is a precaution in case a friend can't get enough money, which was the case with the recent acquisition of Credit Suisse.
It signals concerns over the current banking situation and offers help to non-US banks in case they face similar problems.
This agreement shows the importance of US dollars, as all friends are willing to use them in their plan. It also suggests that tightening money and raising rates might pause soon, as everyone needs to be more careful with their monetary policies.
This news was an indication that the financial system is under pressure and that banks are taking steps to avoid any major crisis.
🗞 “$BTC $1M / Coin Under 90 Days from Today”, bets Former CTO of Coinbase.
💭 Matthew’s Thoughts…
Balaji Srinivasan, the former CTO of Coinbase, has made a public bet that Bitcoin will be above $1M within 90 days due to recent events.
It's important to note that this is an extremely bold prediction, as Bitcoin is currently trading at around $28K.
Srinivasan's hypothesis may be based on recent economic trends and the perceived instability of the traditional banking system.
Inflation rates have been rising rapidly since the pandemic, and many people are looking for alternative investment opportunities to protect their wealth from the devaluation of fiat currencies.
Cryptocurrencies, such as Bitcoin, have emerged as a potential hedge against the traditional banking system due to their decentralized and borderless nature.
Moreover, the recent banking fiasco involving Credit Suisse and other major banks has led many investors to lose confidence in the stability of the financial system.
The fractional reserve banking system, where banks can lend out nearly 100% of customer deposits to create more money, is risky and has led to financial crises in the past.
In contrast, cryptocurrencies operate on a decentralized network, where transactions are verified and recorded by a network of computers, eliminating the need for traditional banks to act as intermediaries.
While it remains to be seen whether Bitcoin will reach the $1M mark within the next 90 days, but Srinivasan's bet and the increasing interest in cryptocurrencies as a hedge against traditional banking systems suggest that the future of finance may be changing rapidly.
As more people begin to embrace cryptocurrencies, we may see a shift away from traditional financial institutions and towards decentralized, blockchain-based networks that offer greater transparency and security.
🗞 Volatility Alert: FOMC Meeting on Wednesday + This Weeks Economic Data
💭 Matthew’s Thoughts…
This week, the US is expected to release a slew of important economic data.
On Tuesday, existing home sales data will be released which will provide an insight into the state of the housing market.
The Federal Reserve is set to make their interest rate decision on Wednesday, which will be closely watched by investors as it may give clues about the future of monetary policy.
Thursday will see the release of jobless claims and new home sales data. These reports will be scrutinized by analysts and investors to assess the overall health of the US economy.
On Friday, the durable goods orders data will be released which tracks the orders for long-lasting goods such as machinery, vehicles and electronics.
Additionally, the services and manufacturing PMI reports will be released on Friday, providing a glimpse into the health of these sectors of the economy.


We have an action packed week ahead but my eyes will be glued to any headlines from the U.S Treasury, particularly Janet Yellen as her most recent testimony in congress was an absolute disaster and she isn’t carrying the body language of a trusted government official who appears certain that the system is ‘stable’.
Watch below, it’s cringe.

Fox MetaCapital’s Weekly Asset Review + Technical Analysis
📈📉 The Week Ahead in Charts
Symbols 📈 or 🐂 = Bullish / Positive | 📉 or 🧸 = Bearish or Negative | ⚖️ Ranging or Low Volatility
FOREX
📉 DXY(U.S Dollar) + ⚖️ CAD
💬 Matthew’s Commentary, Analysis & Prediction for the Week Ahead:
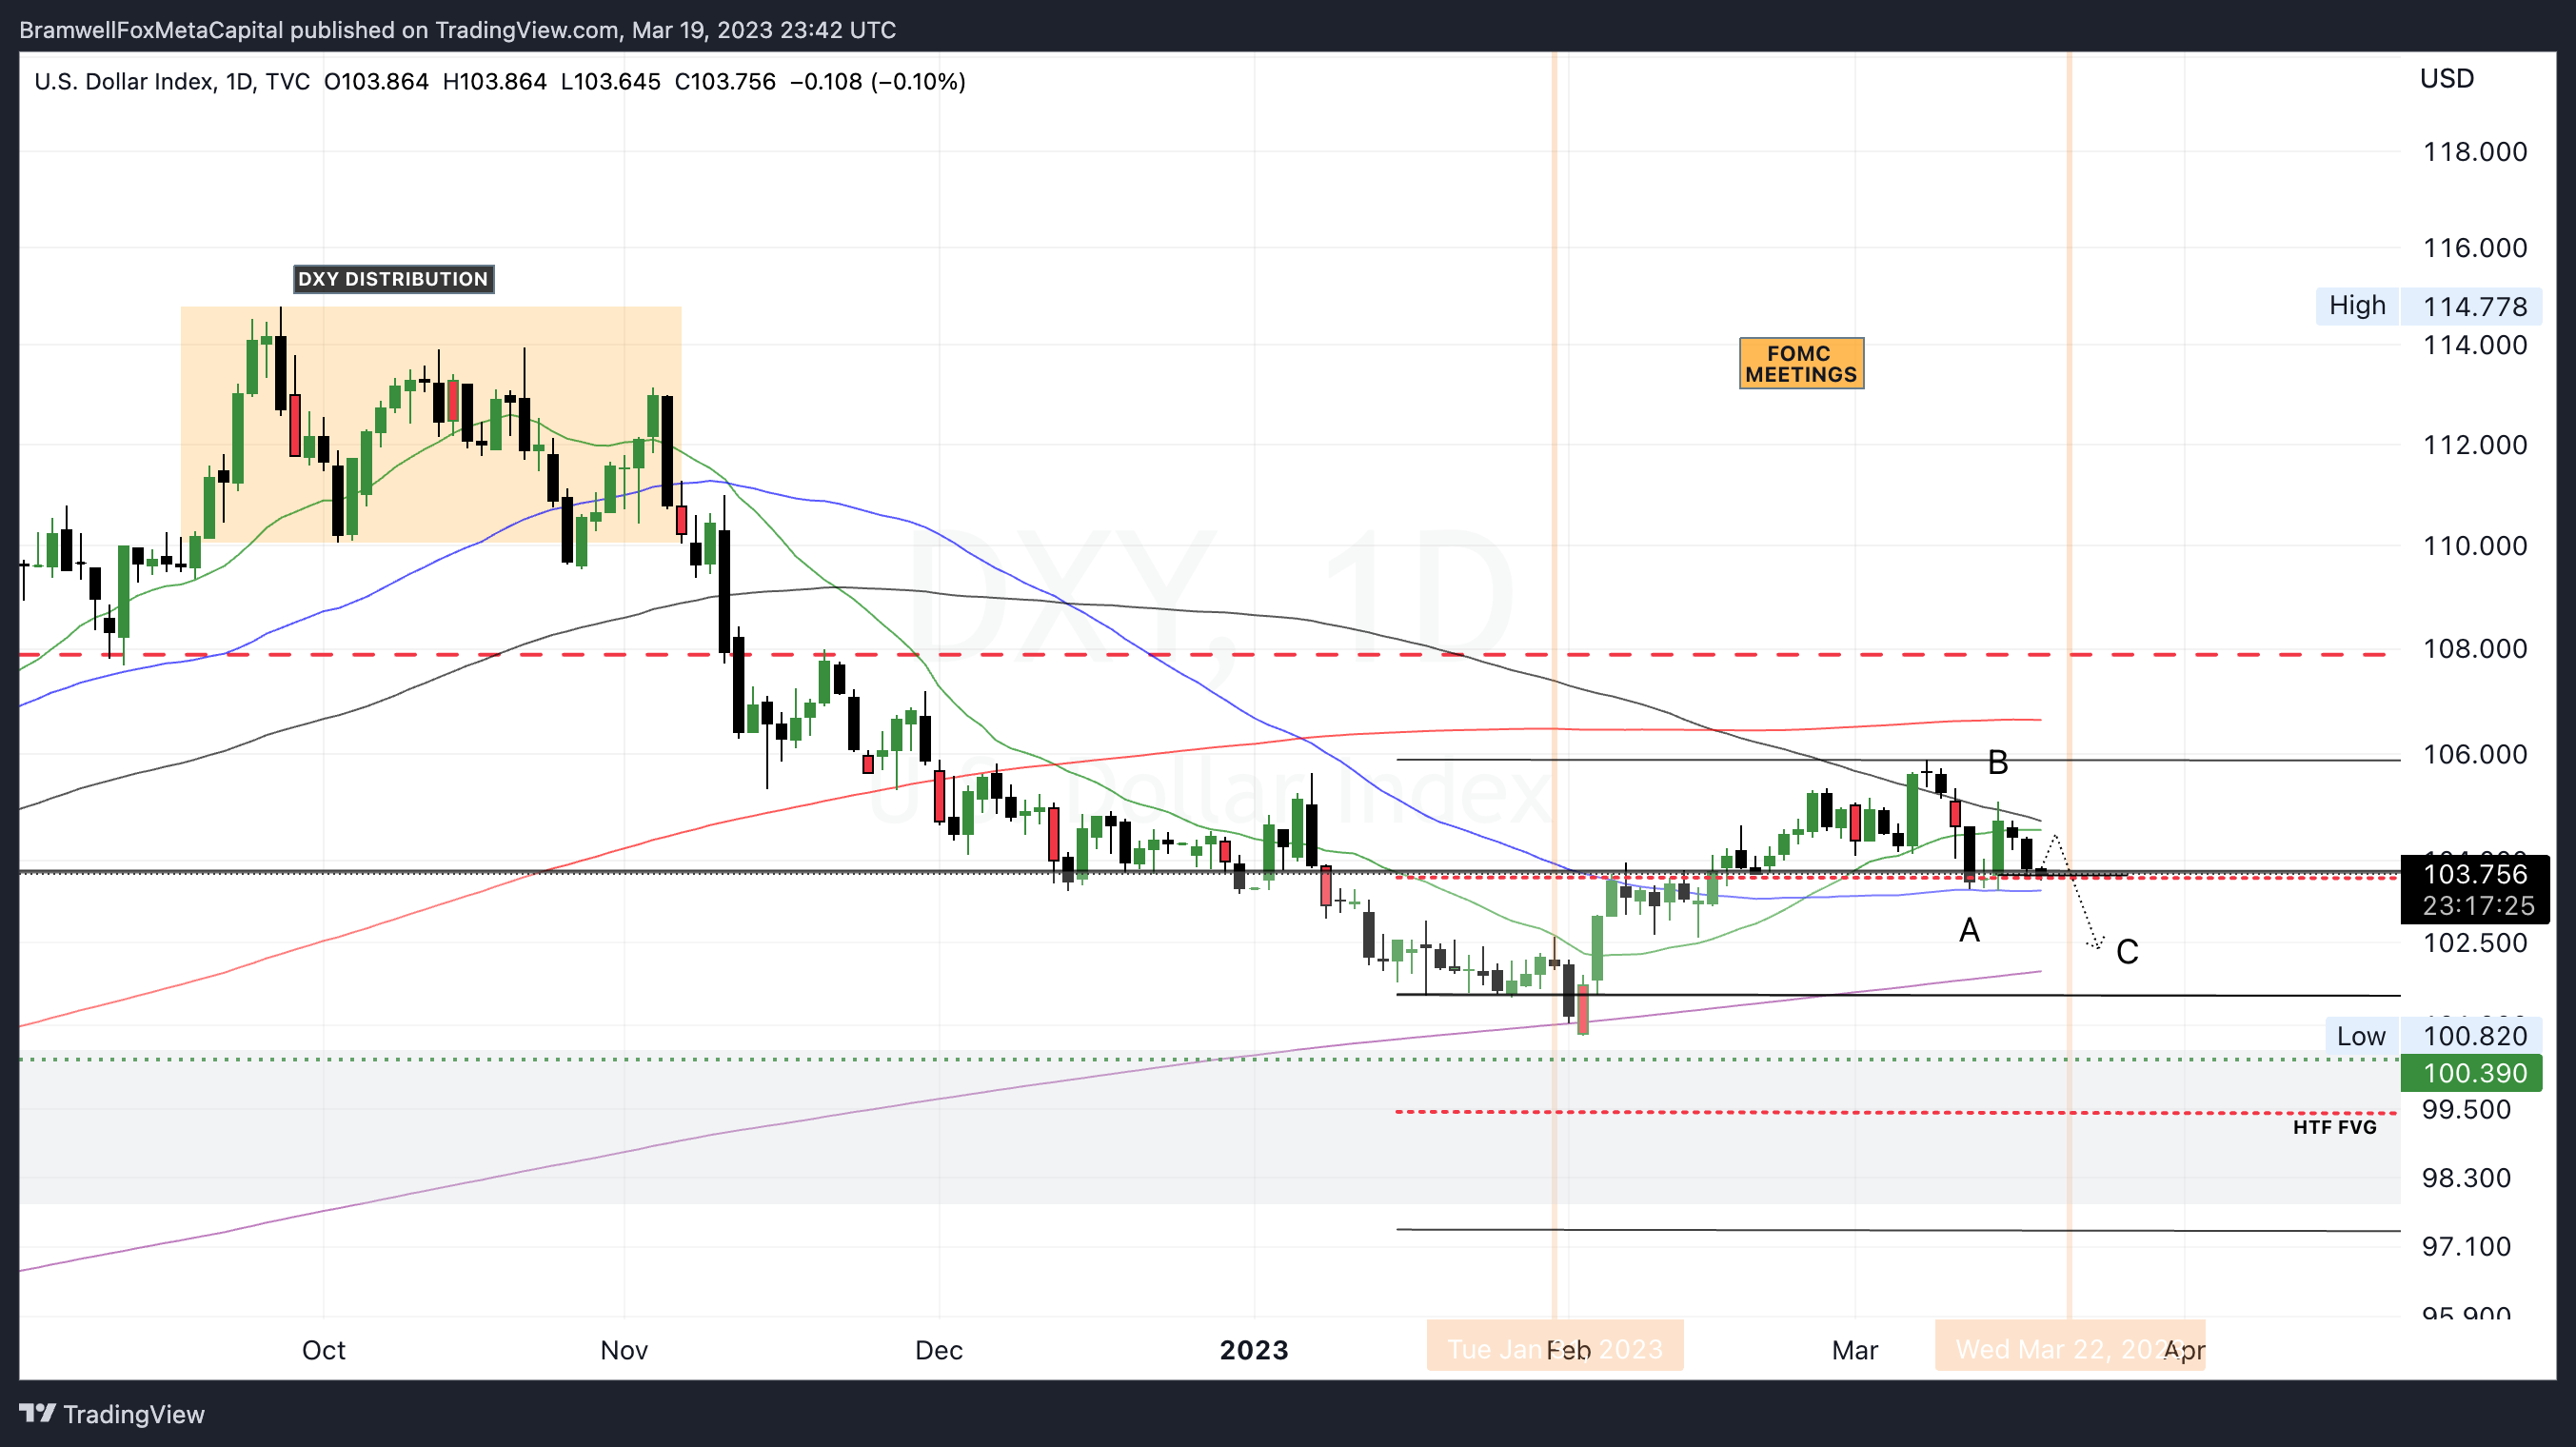
Regardless of le narrative du jour, the US Dollar Index (DXY) is still trading below its 200-day moving average and is finding support at the median range created by February's rally.
If you're optimistic, you would assume that the US Dollar will continue its recent rally, and that the low point reached in February marks a bottom. If this is the case, there is still potential for the Dollar to correct during its C wave, then consolidate demand between 102-104 before a volume spike pushes the DXY up onto its next leg.
However, if you're pessimistic, you would see the recent rally as simply a countertrend move and expect the US Dollar to continue to decline in the days and weeks ahead. A bearish outlook may target a range below 1 standard deviation below, specifically 99.5, as an ultimate target.
Based on current market conditions, I see the charts in a way that has the US Dollar closing the week on a bearish note as when I look at the technicals of other currencies, most are sitting on significant support regions, and my intuition suggests that the Federal Reserve will increase interest rates by .25bps.
While this increase in interest rates may be an economic nuisance, it is likely already factored into market participants' risk appetite.
Ultimately, this will decrease demand for the dollar and provide liquidity to flow into fundamentally strong risk assets.
Featured Chart DXY 1D (click to enlarge photo)
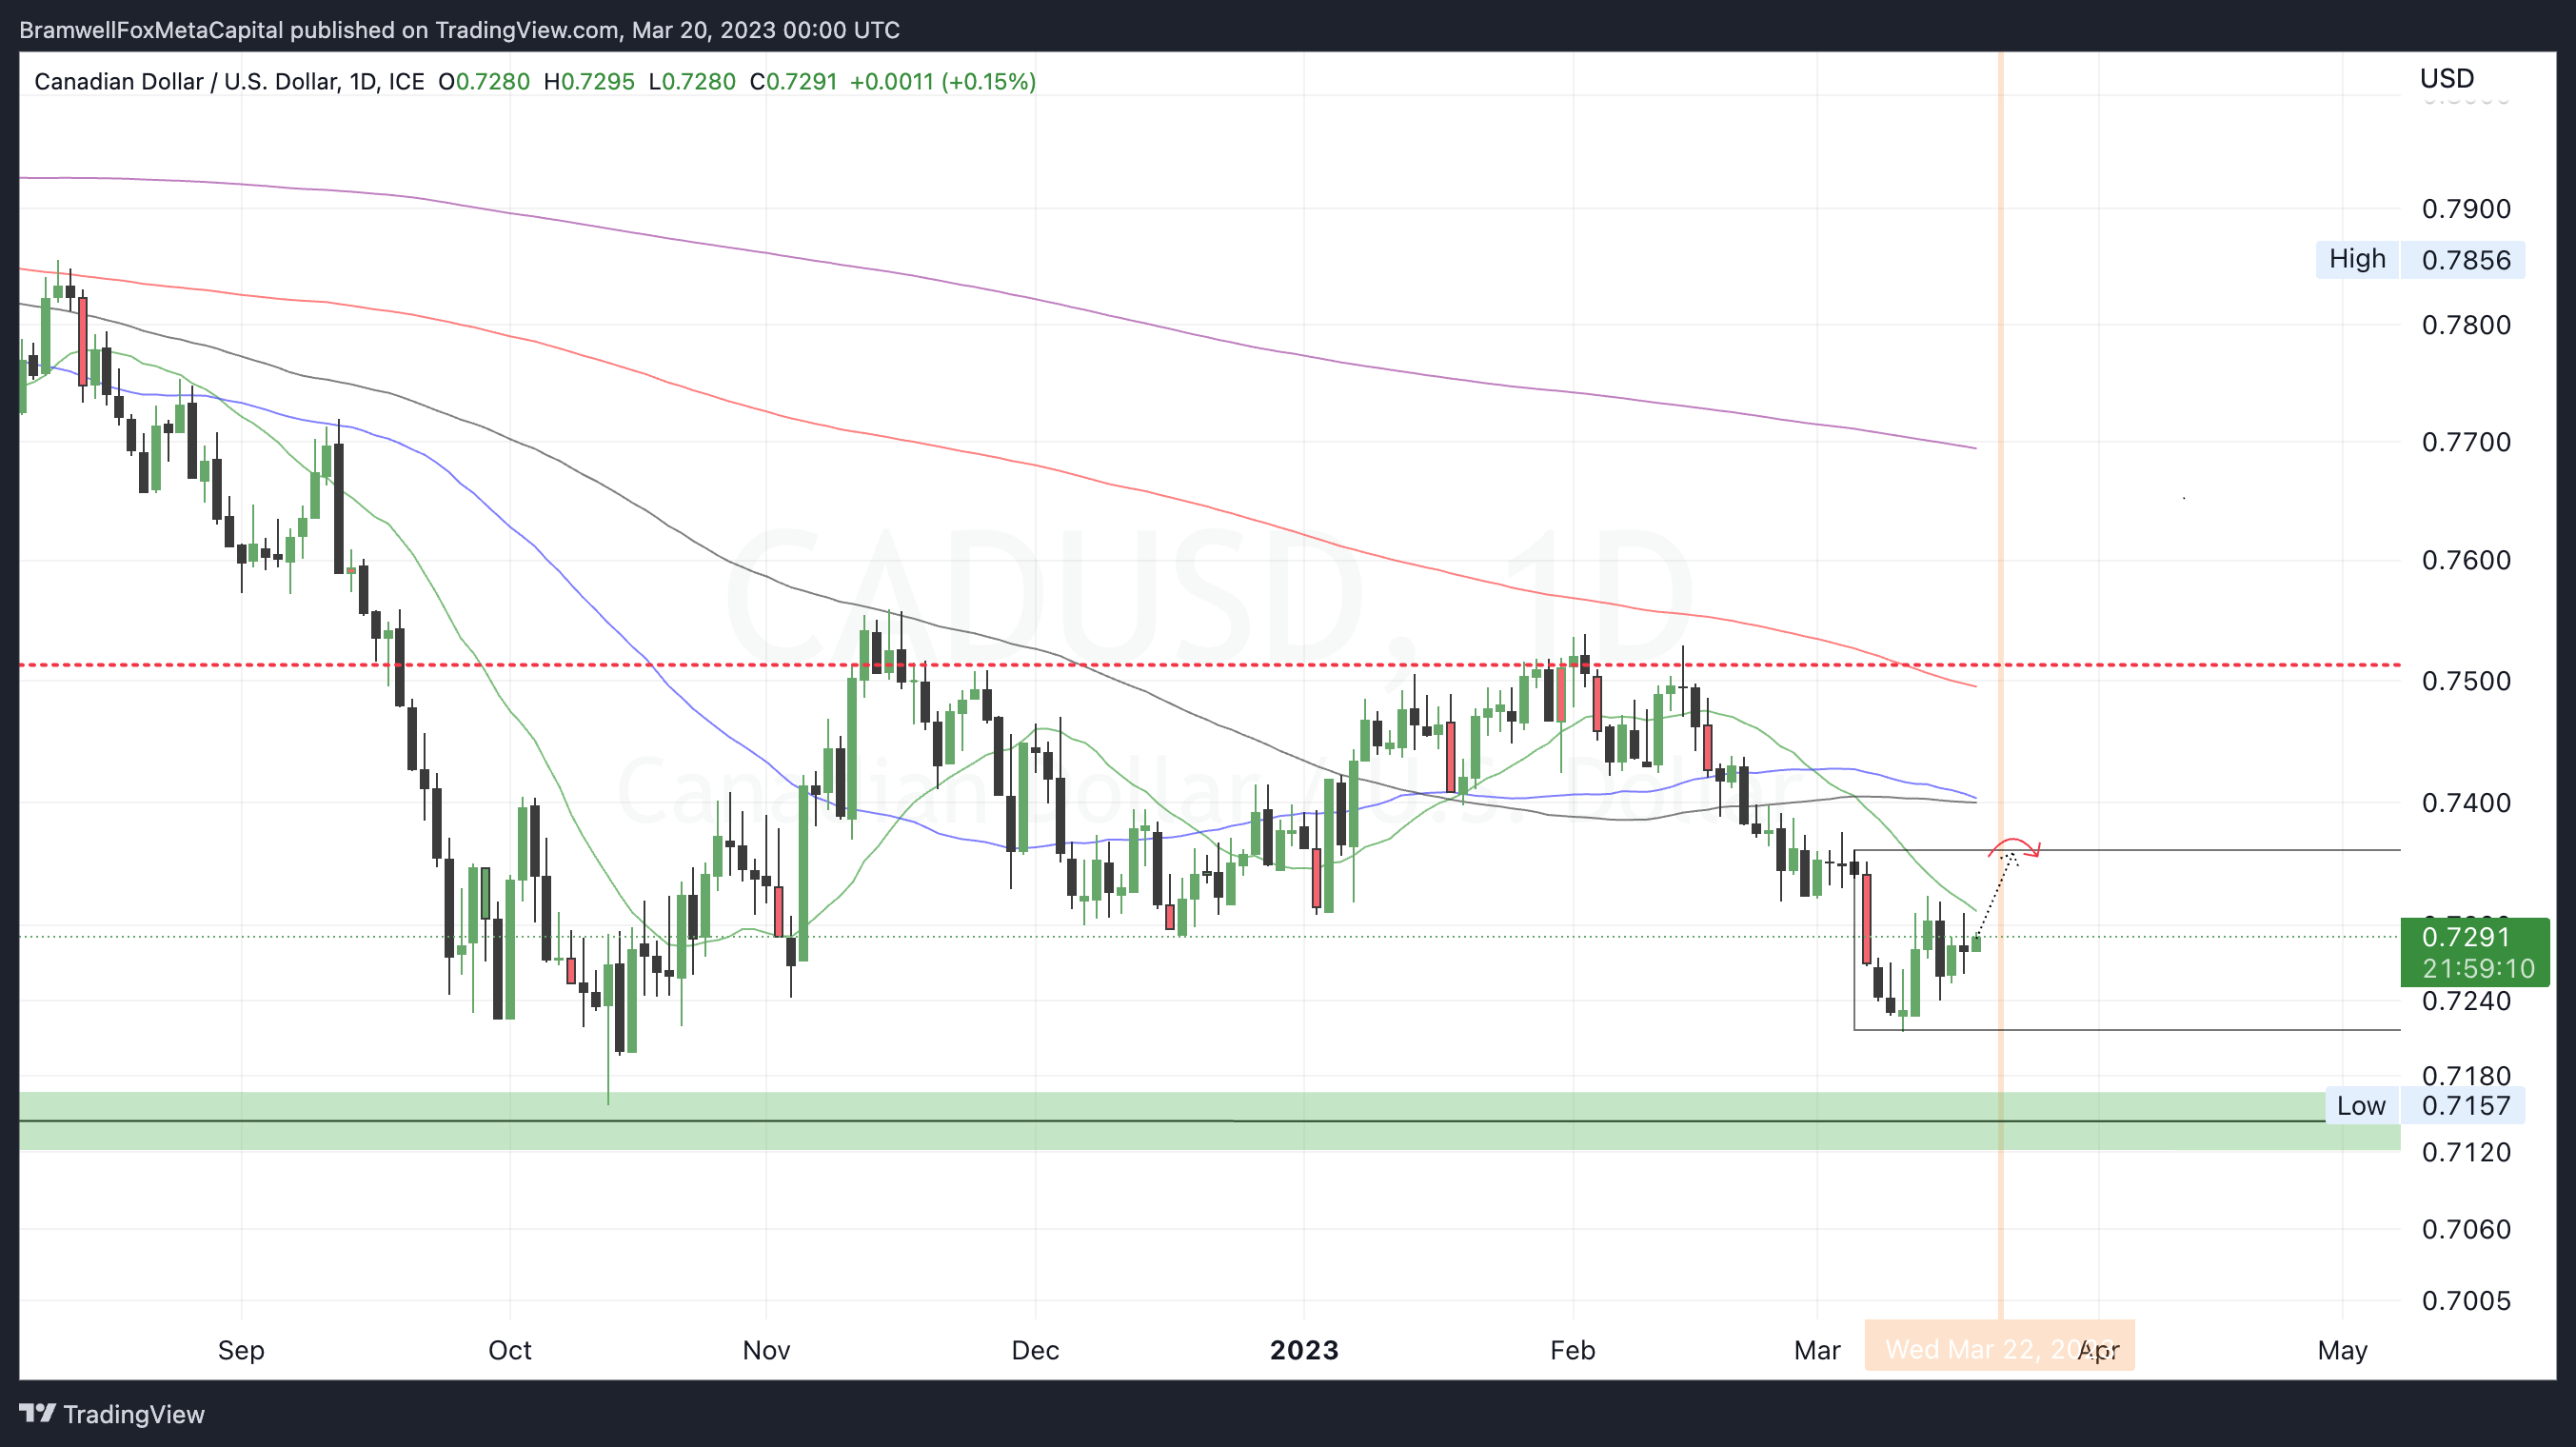
If the US Dollar experiences a bearish event and drops in value, this can cause the Canadian Dollar to strengthen against it.
This is because the Canadian Dollar and the US Dollar have historically had a negative correlation. When one gets stronger, the other gets weaker.
However, whether or not the Canadian Dollar can maintain its strength during a US Dollar downturn depends on several factors. These include the strength of Canada's economy, geopolitical events, and overall market sentiment.
If there is also a liquidity crisis, as the headlines appear to be forecasting, it can further impact the prices of commodities and ultimately affect the Canadian Dollar.
A liquidity crisis can and likely will lead to a decrease in demand for commodities, which can cause commodity prices to fall.
This, in turn, can impact the Canadian Dollar since Canada is a major exporter of commodities such as oil, gold, and copper.
Featured Chart CAD 1D (click to enlarge photo)
Equities
📈 S&P500 + ⚖️ TSX + VIX 📈
💬 Matthew’s Commentary, Analysis & Prediction for the Week Ahead:
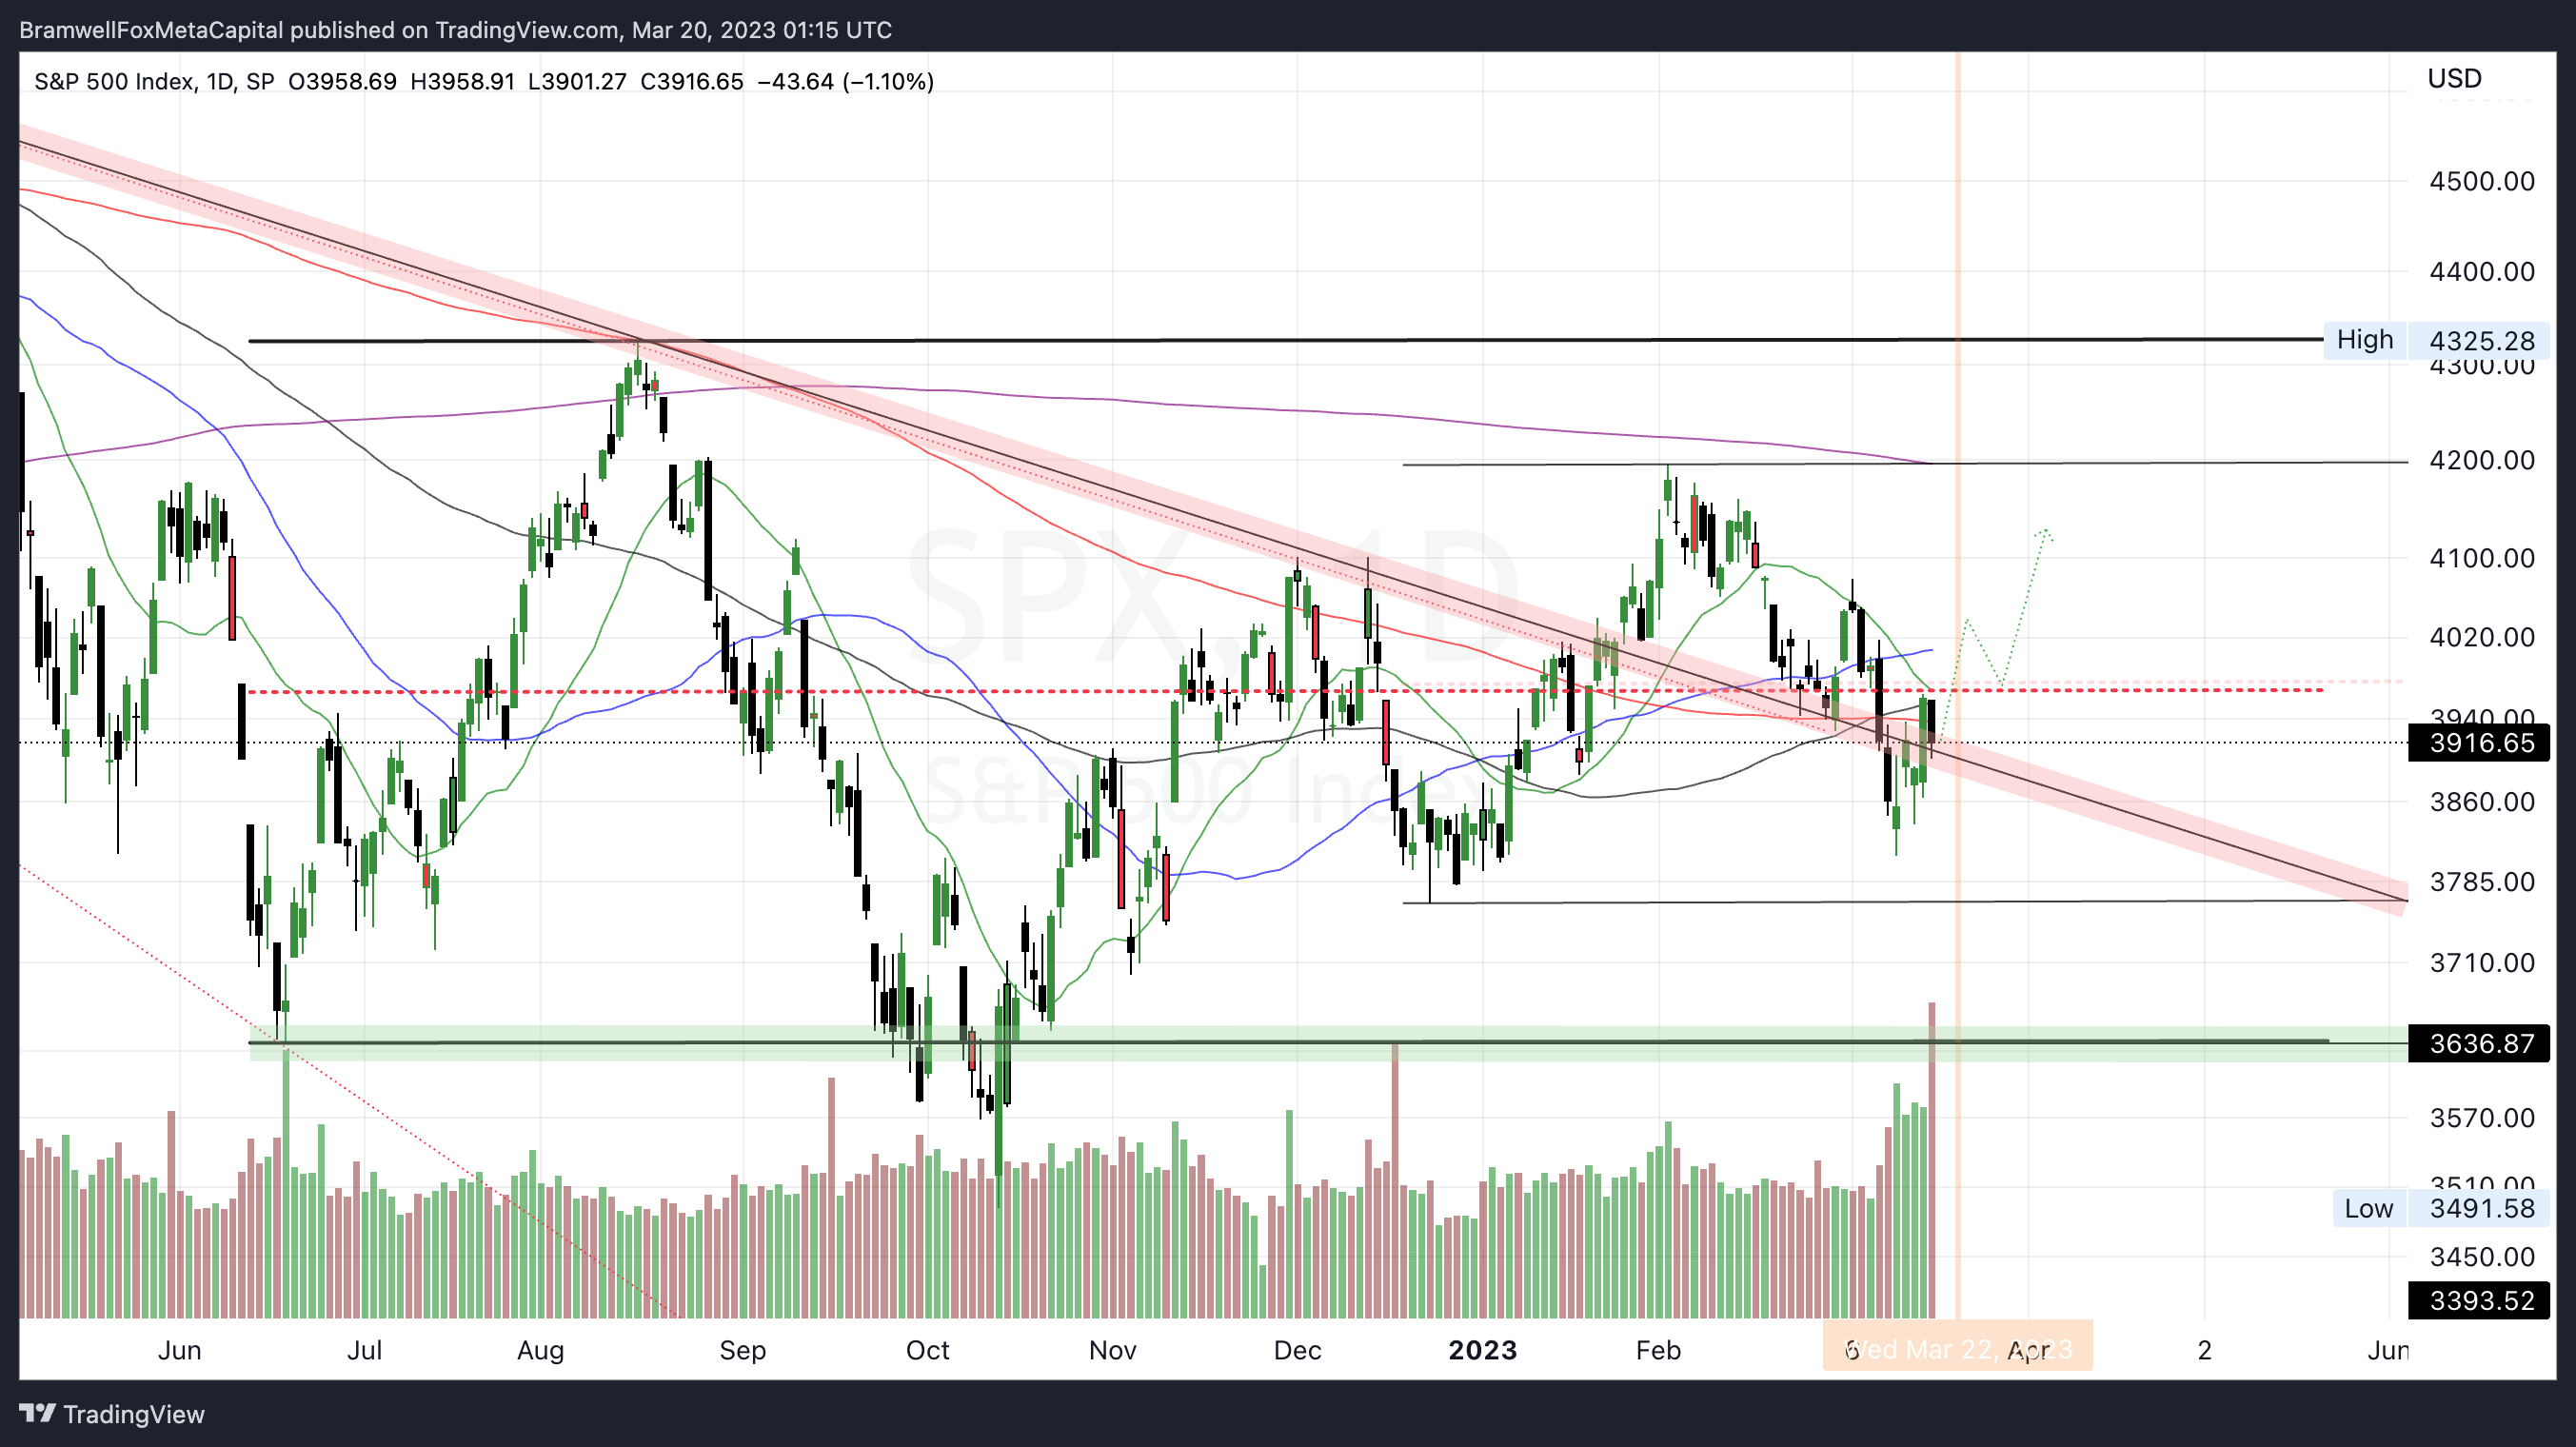
The S&P500 is currently testing its bear market resistance level while sitting at the monthly and weekly range median, waiting for the FOMC decision on Wednesday.
This is the perfect storm that has trapped many buyers and sellers in a precarious position, where they may be overleveraged on either side of the fair market price, expecting their bias to be correct on what comes next.
We see that in October, the market attempted to break down below its range, but it failed to do so, resulting in a Swing Failure Pattern, a market reversal. Since then, the S&P500 has formed a series of higher lows and higher highs, indicating a bullish trend - many speculated the ‘bear market had ended’.
However, the market has not yet formed a significant higher timeframe higher-high, which has raised concerns about the overall structure of the market. This has led to comparisons with chart patterns seen during the 1929 Great Depression and the 2008 housing market collapse. If the momentum of this rally loses strength, it could lead to a complete collapse of US equities.
On the other hand, it is also possible that the index may continue to push up and re-test the range high around 4325. It's important to note that any significant news headline causing fear in the market may just be a distraction, while larger players buy up assets at lower prices.
Despite the media's negative outlook, I see this recent correction as an aggressive retest of the diagonal resistance.
In the coming days and weeks, I believe that the bears will be squeezed to the upside and I’m targeting 4200 within the next 14 days.
Yet, I wouldn’t consider myself bullish, as much as expecting choppy action and selectively-aggressive moves by institutional funds whom are re-distributing capital while there is uncertainly being spewed by the media.
Featured Chart S&P500 1D (click to enlarge photo)
Given the falling oil prices and commodity prices, coupled with the Bank of Canada's decision to pause rates, it is likely that the TSX will consolidate sideways over the next few weeks as it forms a support range highlighted in yellow.
Yet, I’ll still admit the TSX could be in BIG trouble IF it’s forming a high timeframe bear flag. This means that further corrective action (or significant downside) could happen if the TSX loses the median support (that red dotted line) of the range.
But, the future is too uncertain to make that call with confidence so right now it's all about keeping an eye on how the equity index’s react after FOMC, as this could create some wild volatility and give sellers the opportunity to clear the fair value gap in the charts.
I’d expect to see a sharp V-shaped reversal back into range highs, signaling a potential upward trend in the market if we want to invalidate further downside.
Featured Chart TSX 1W (click to enlarge photo)
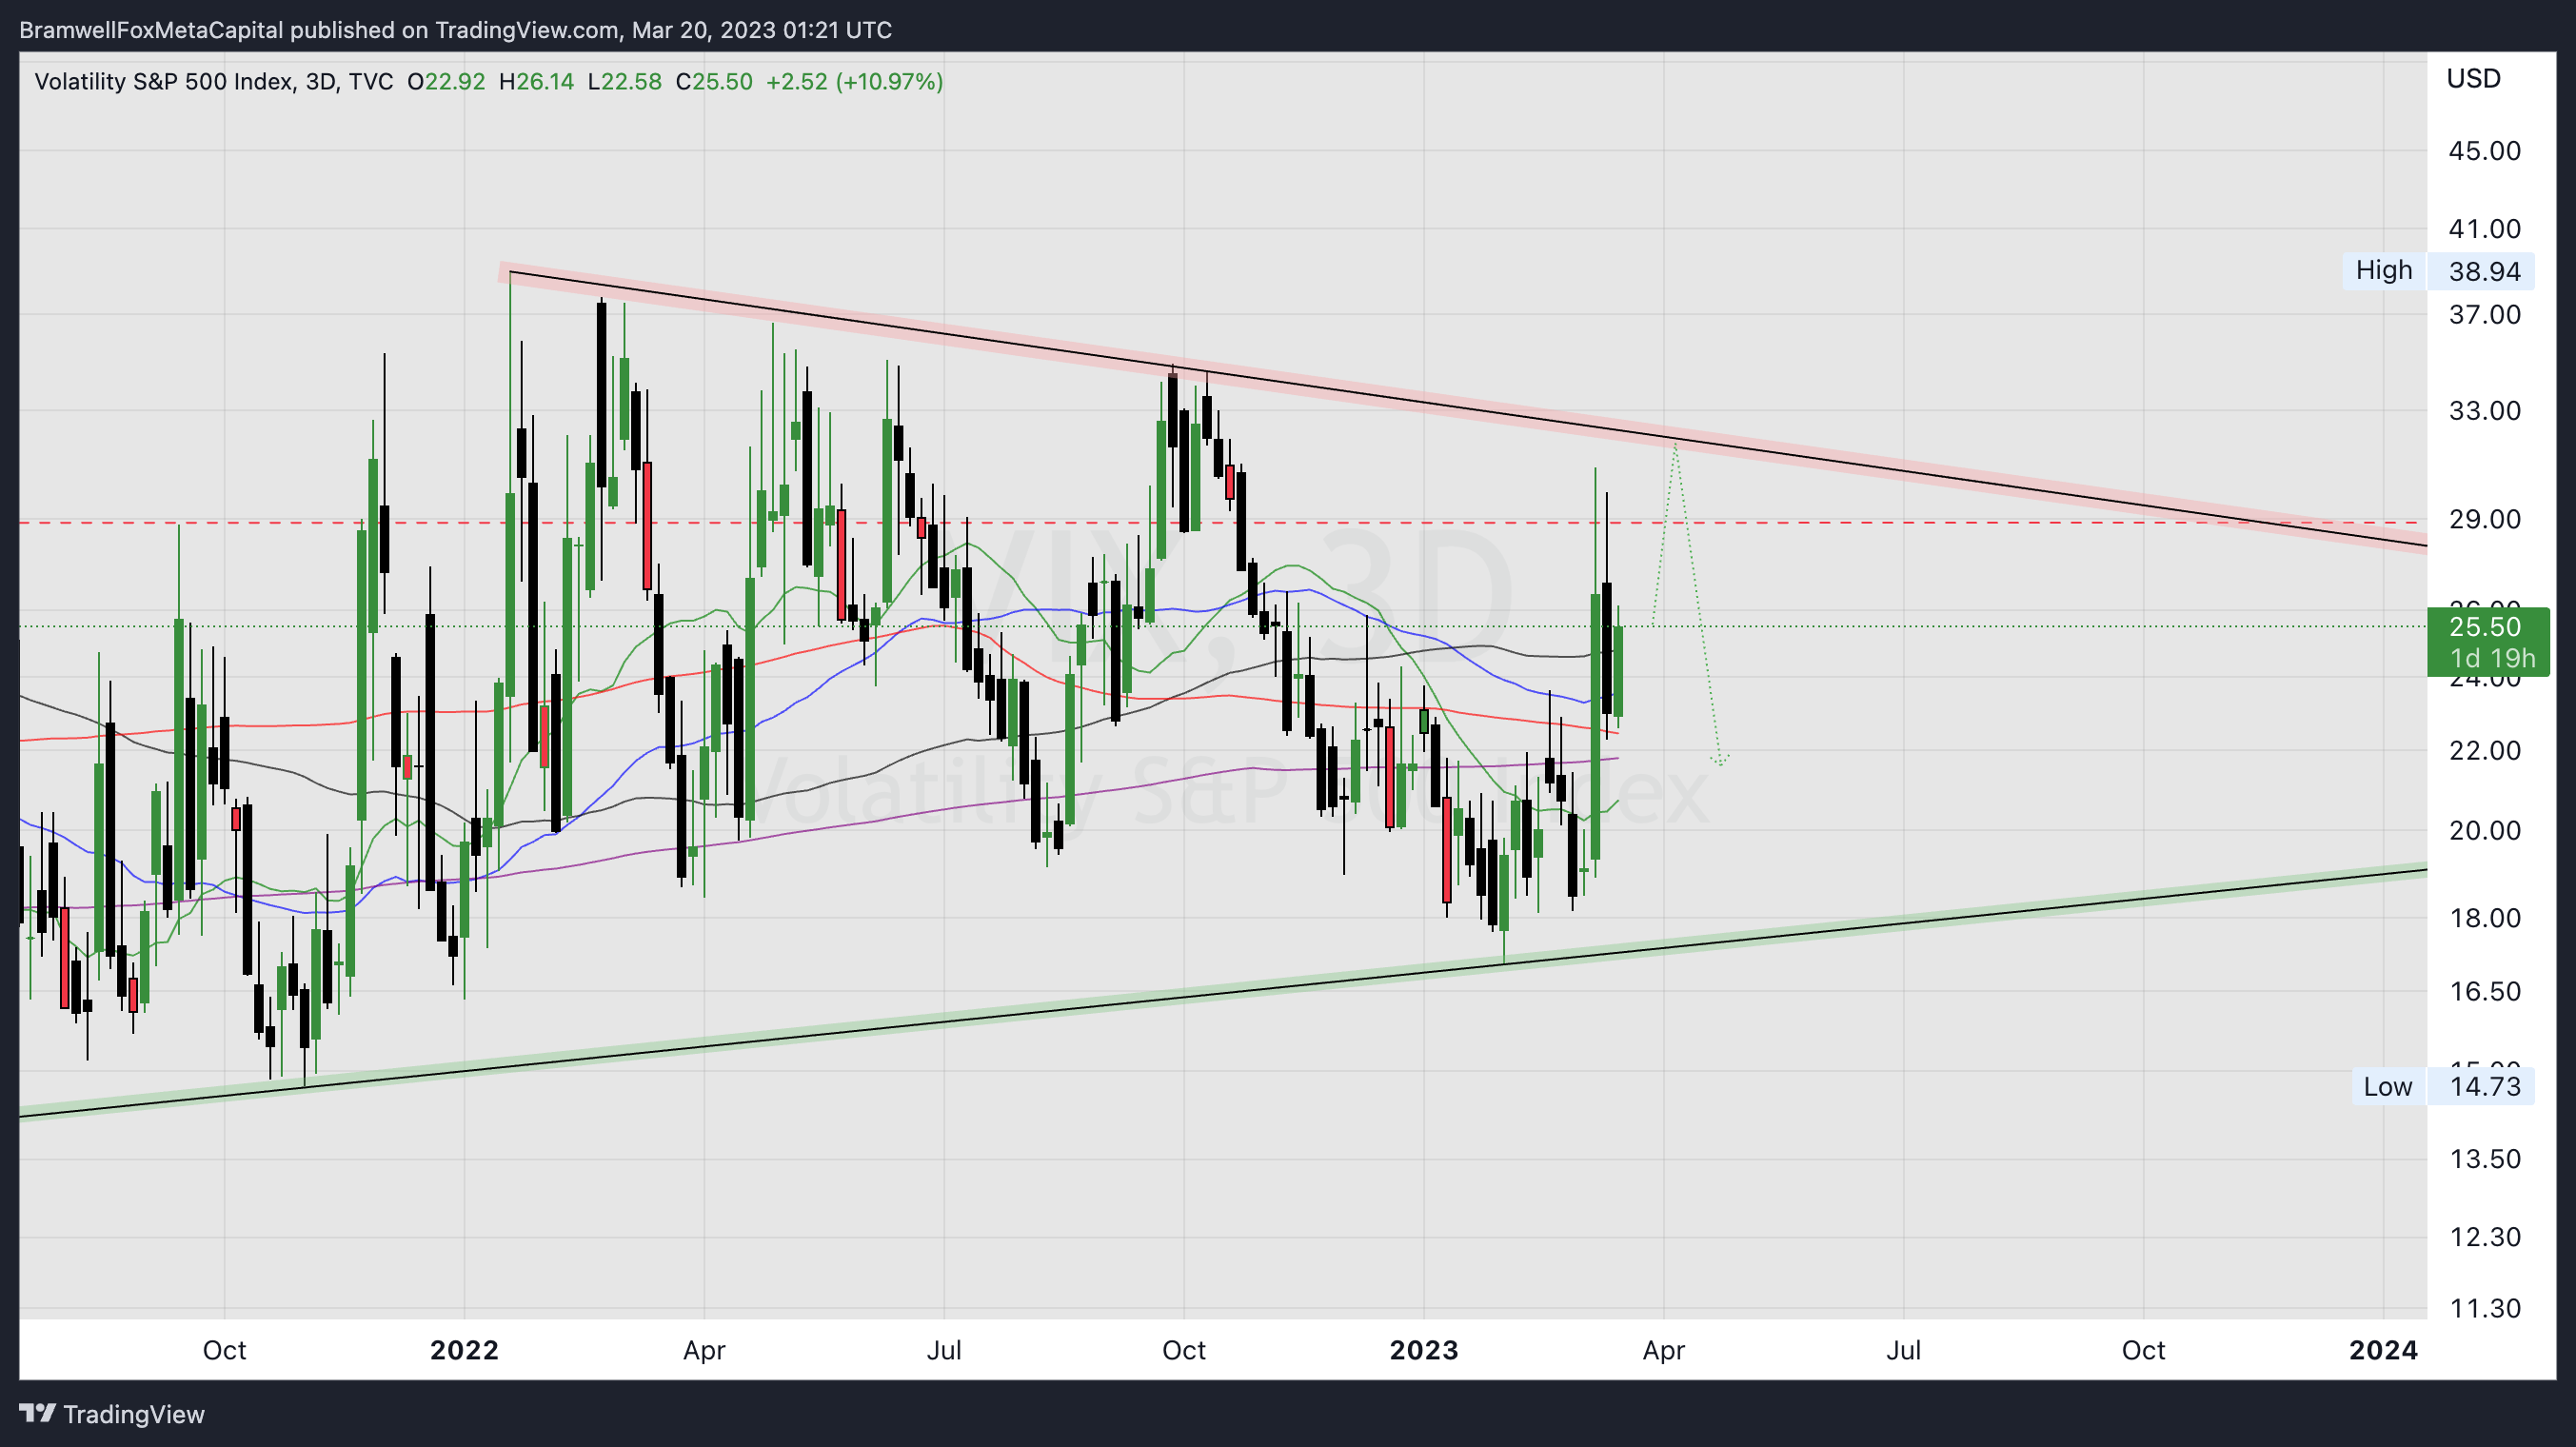
Don't forget, the VIX (Volatility Index) is typically inversely related to the S&P500 because it measures potential or ongoing market volatility.
This chart is also known as the Fear/Greed index of market participants.
eg.
when up = fear/bearish
when down = greed/bullish.
The early part of the week may see higher volatility as investors react to ongoing headlines about bank solvency and liquidity. They'll also be speculating on the direction the FED will take interest rates on Wednesday.
If the VIX touches 31.25 and then drops mid-week, it could be a great buying opportunity. We might see further upside across risk assets in the short term, so keep your eyes peeled!
Featured Chart VIX 1D (click to enlarge photo)
Treasuries
📉 US2YR & 📉 US10YR
💬 Matthew’s Commentary, Analysis & Prediction for the Week Ahead:
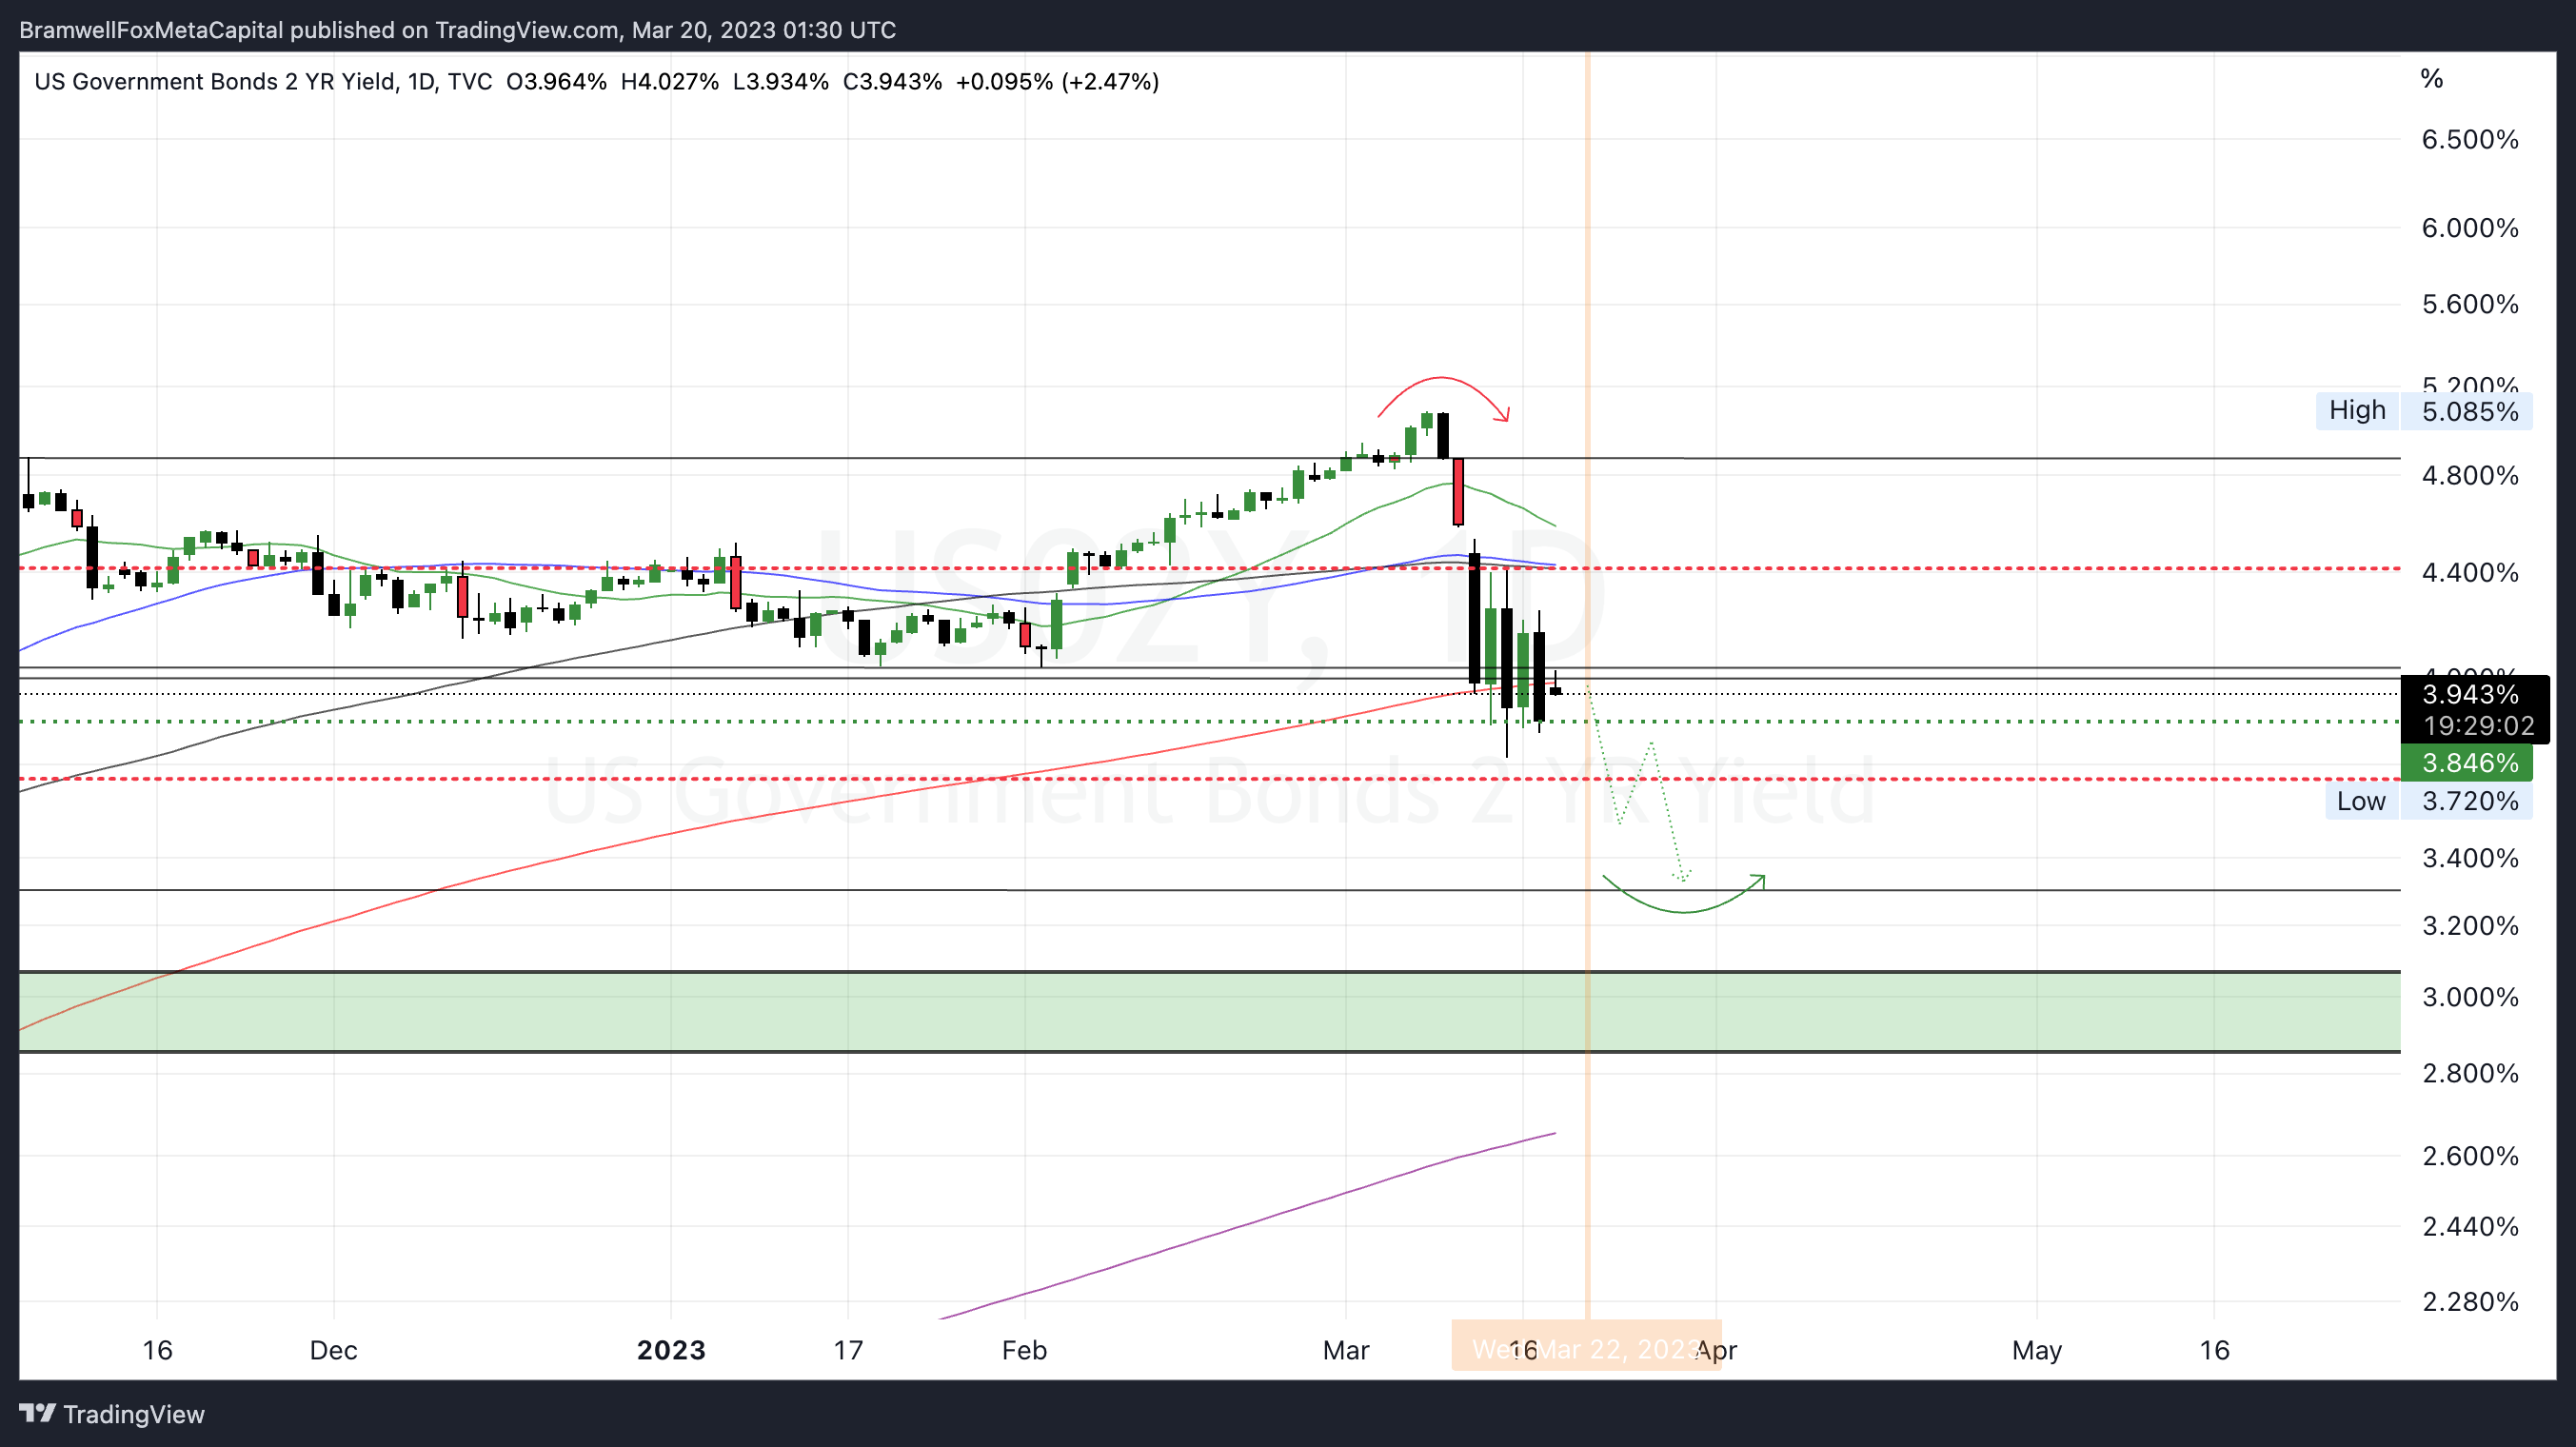
Treasury yields are finally collapsing, which suggests that market investors are speculating that the Federal Reserve (Fed) is cornered into either pausing or reducing the pace of rate hikes.
This market bias is partly due to the foreseeable political optics surrounding a slew of bank liquidity shortages dominating headlines in March, from the bankruptcy of Silicon Valley Bank to the forceful closure of Signature Bank and now Credit Suisse. Banks are taking huge balance sheet losses due to falling treasury prices, which used to be a safe haven investment that many banks parked their capital in to earn a yield spread.
This unique situation is a symptom of over-quantitative tightening by central banks, and it has caused many investors and institutions to chase higher short-term yields on the Fed funds rate rather than locking up their funds with the U.S. government.
The Fed has a big week ahead as they weigh these factors carefully before making their final decision. While they have been determined to combat high inflation, it's equally important to avoid disrupting capital markets.
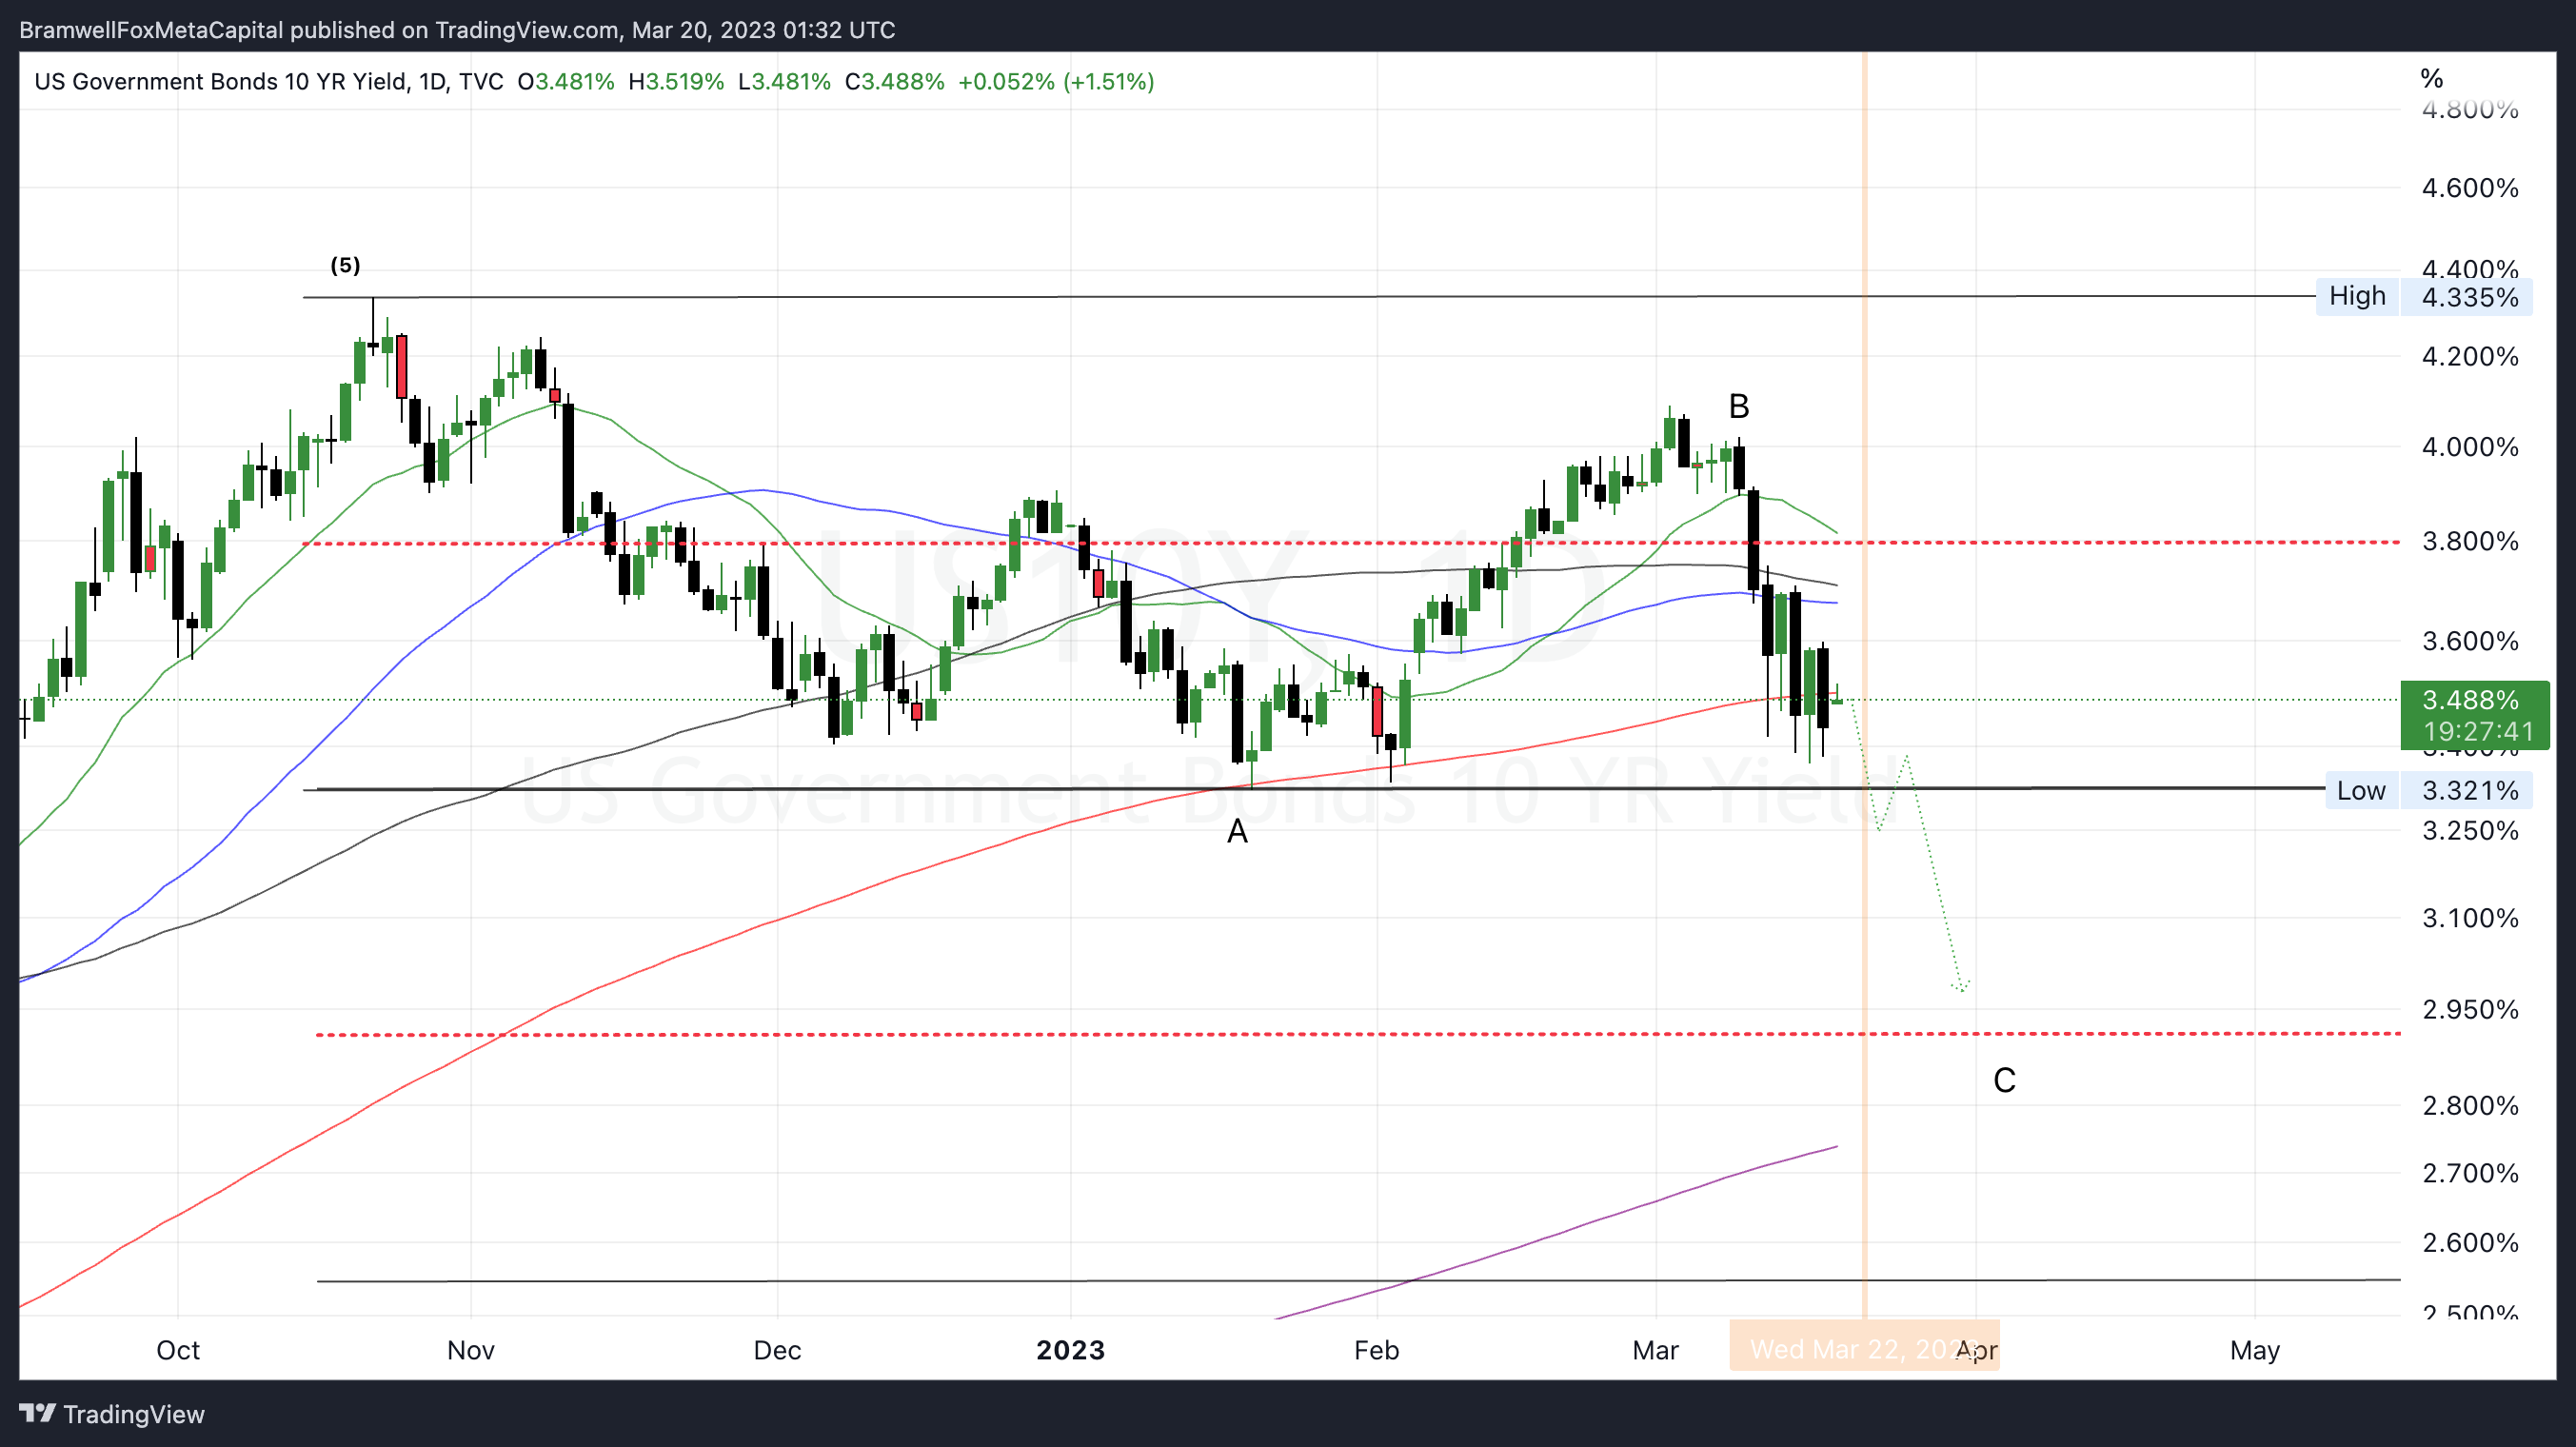
I expect Treasury yields to continue their downward trend, with the 2-year falling into the low 3.25% range and the 10-year into the 3% range.
Featured Chart US2YR 1D (click to enlarge photo)
Featured Chart US10YR 1D (click to enlarge photo)
Cryptocurrencies
📈 Bitcoin + 📈 XRP & + 📈 Total Altcoin Market Cap
💬 Matthew’s Commentary, Analysis & Prediction for the Week Ahead:
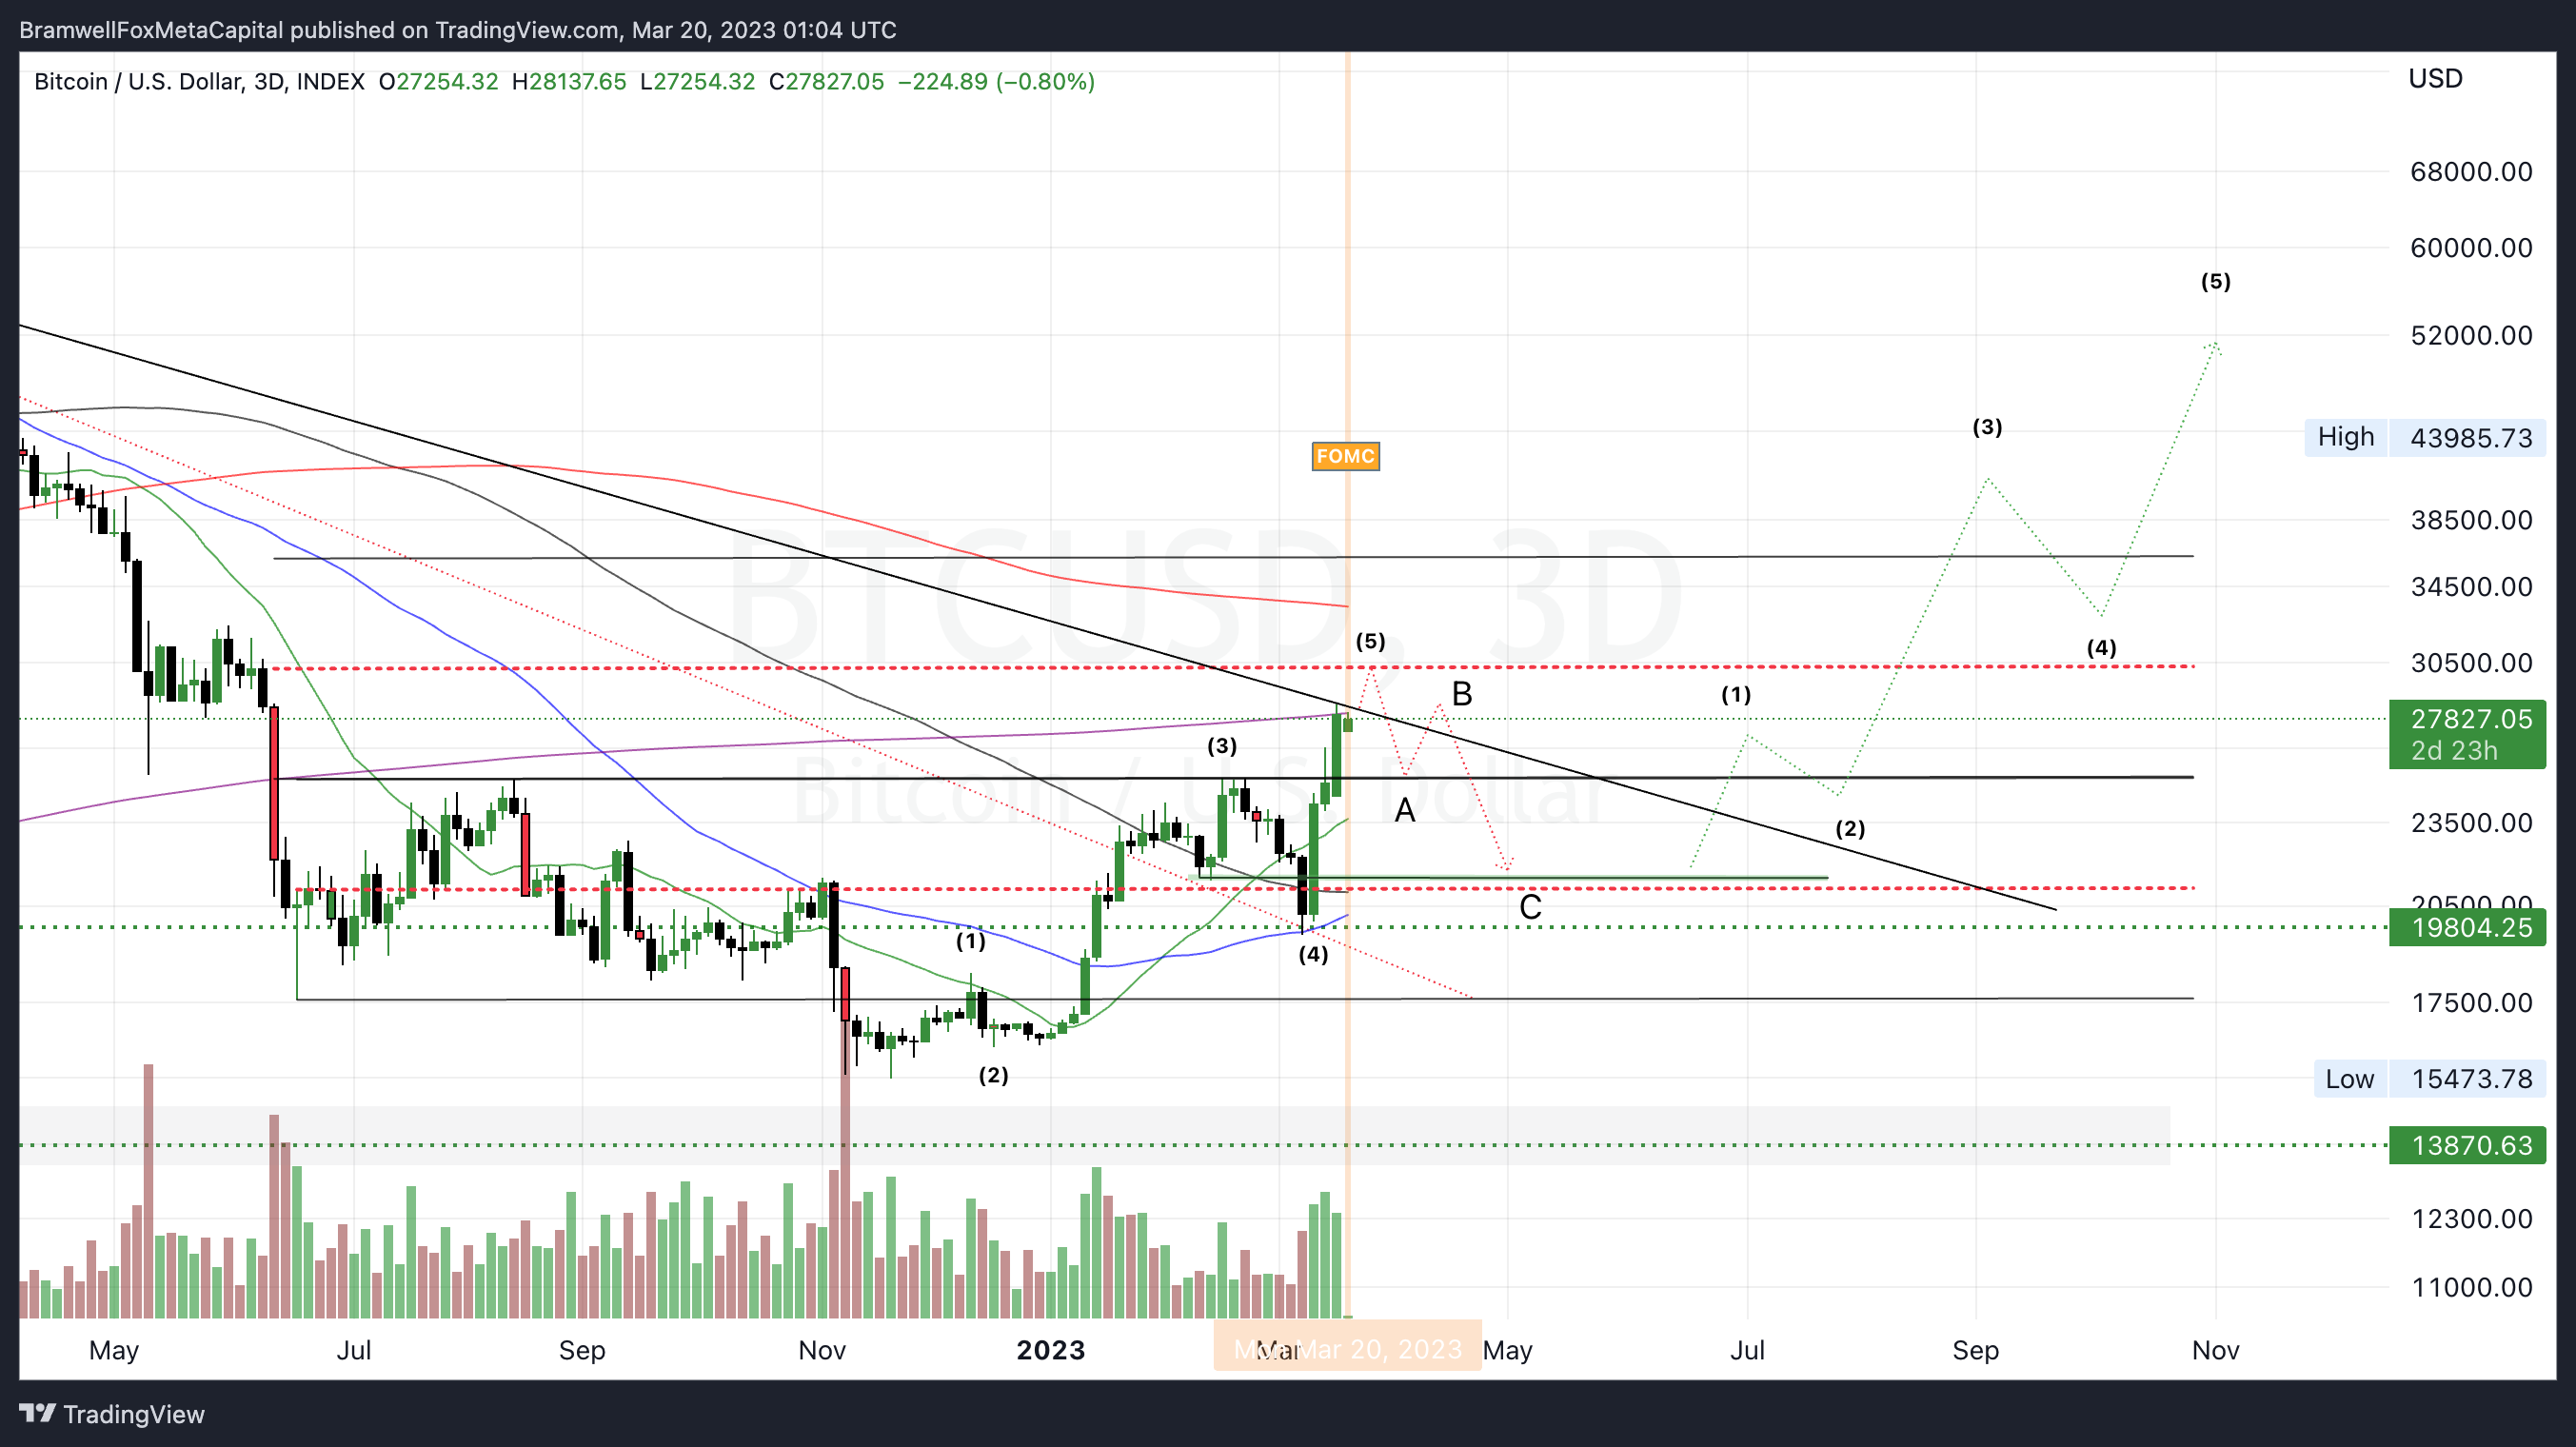
Bitcoin leading all global assets with over a 65% appreciation in value on year.
This most recent rally to 28K may be attributed to the exodus of deposit holders from small-medium sized banks + speculation that the global financial system is too fragile to trust in it’s current state, leading investors to the blockchain and cryptocurrencies as a safe haven.


The irony.
While this rally is overdue for a correction, I am closely watching the headlines this week as it wouldn’t surprise me if Bitcoin decides to push up another 5-10% and squeeze out any late shorters whom are over leveraged and assuming we have already printed a local top.
When this correction does eventually occur in the coming days / weeks, those profits will be rotated into the Alt-Coin market cap.
I'm anticipating the $BTC price to tag around $30,500 before the correction, and I believe there will be a big spot buy opportunity around $20,500-$21,500 per coin in Q2 if you missed the first rally.
Featured Chart BTC 1D (click to enlarge photo)
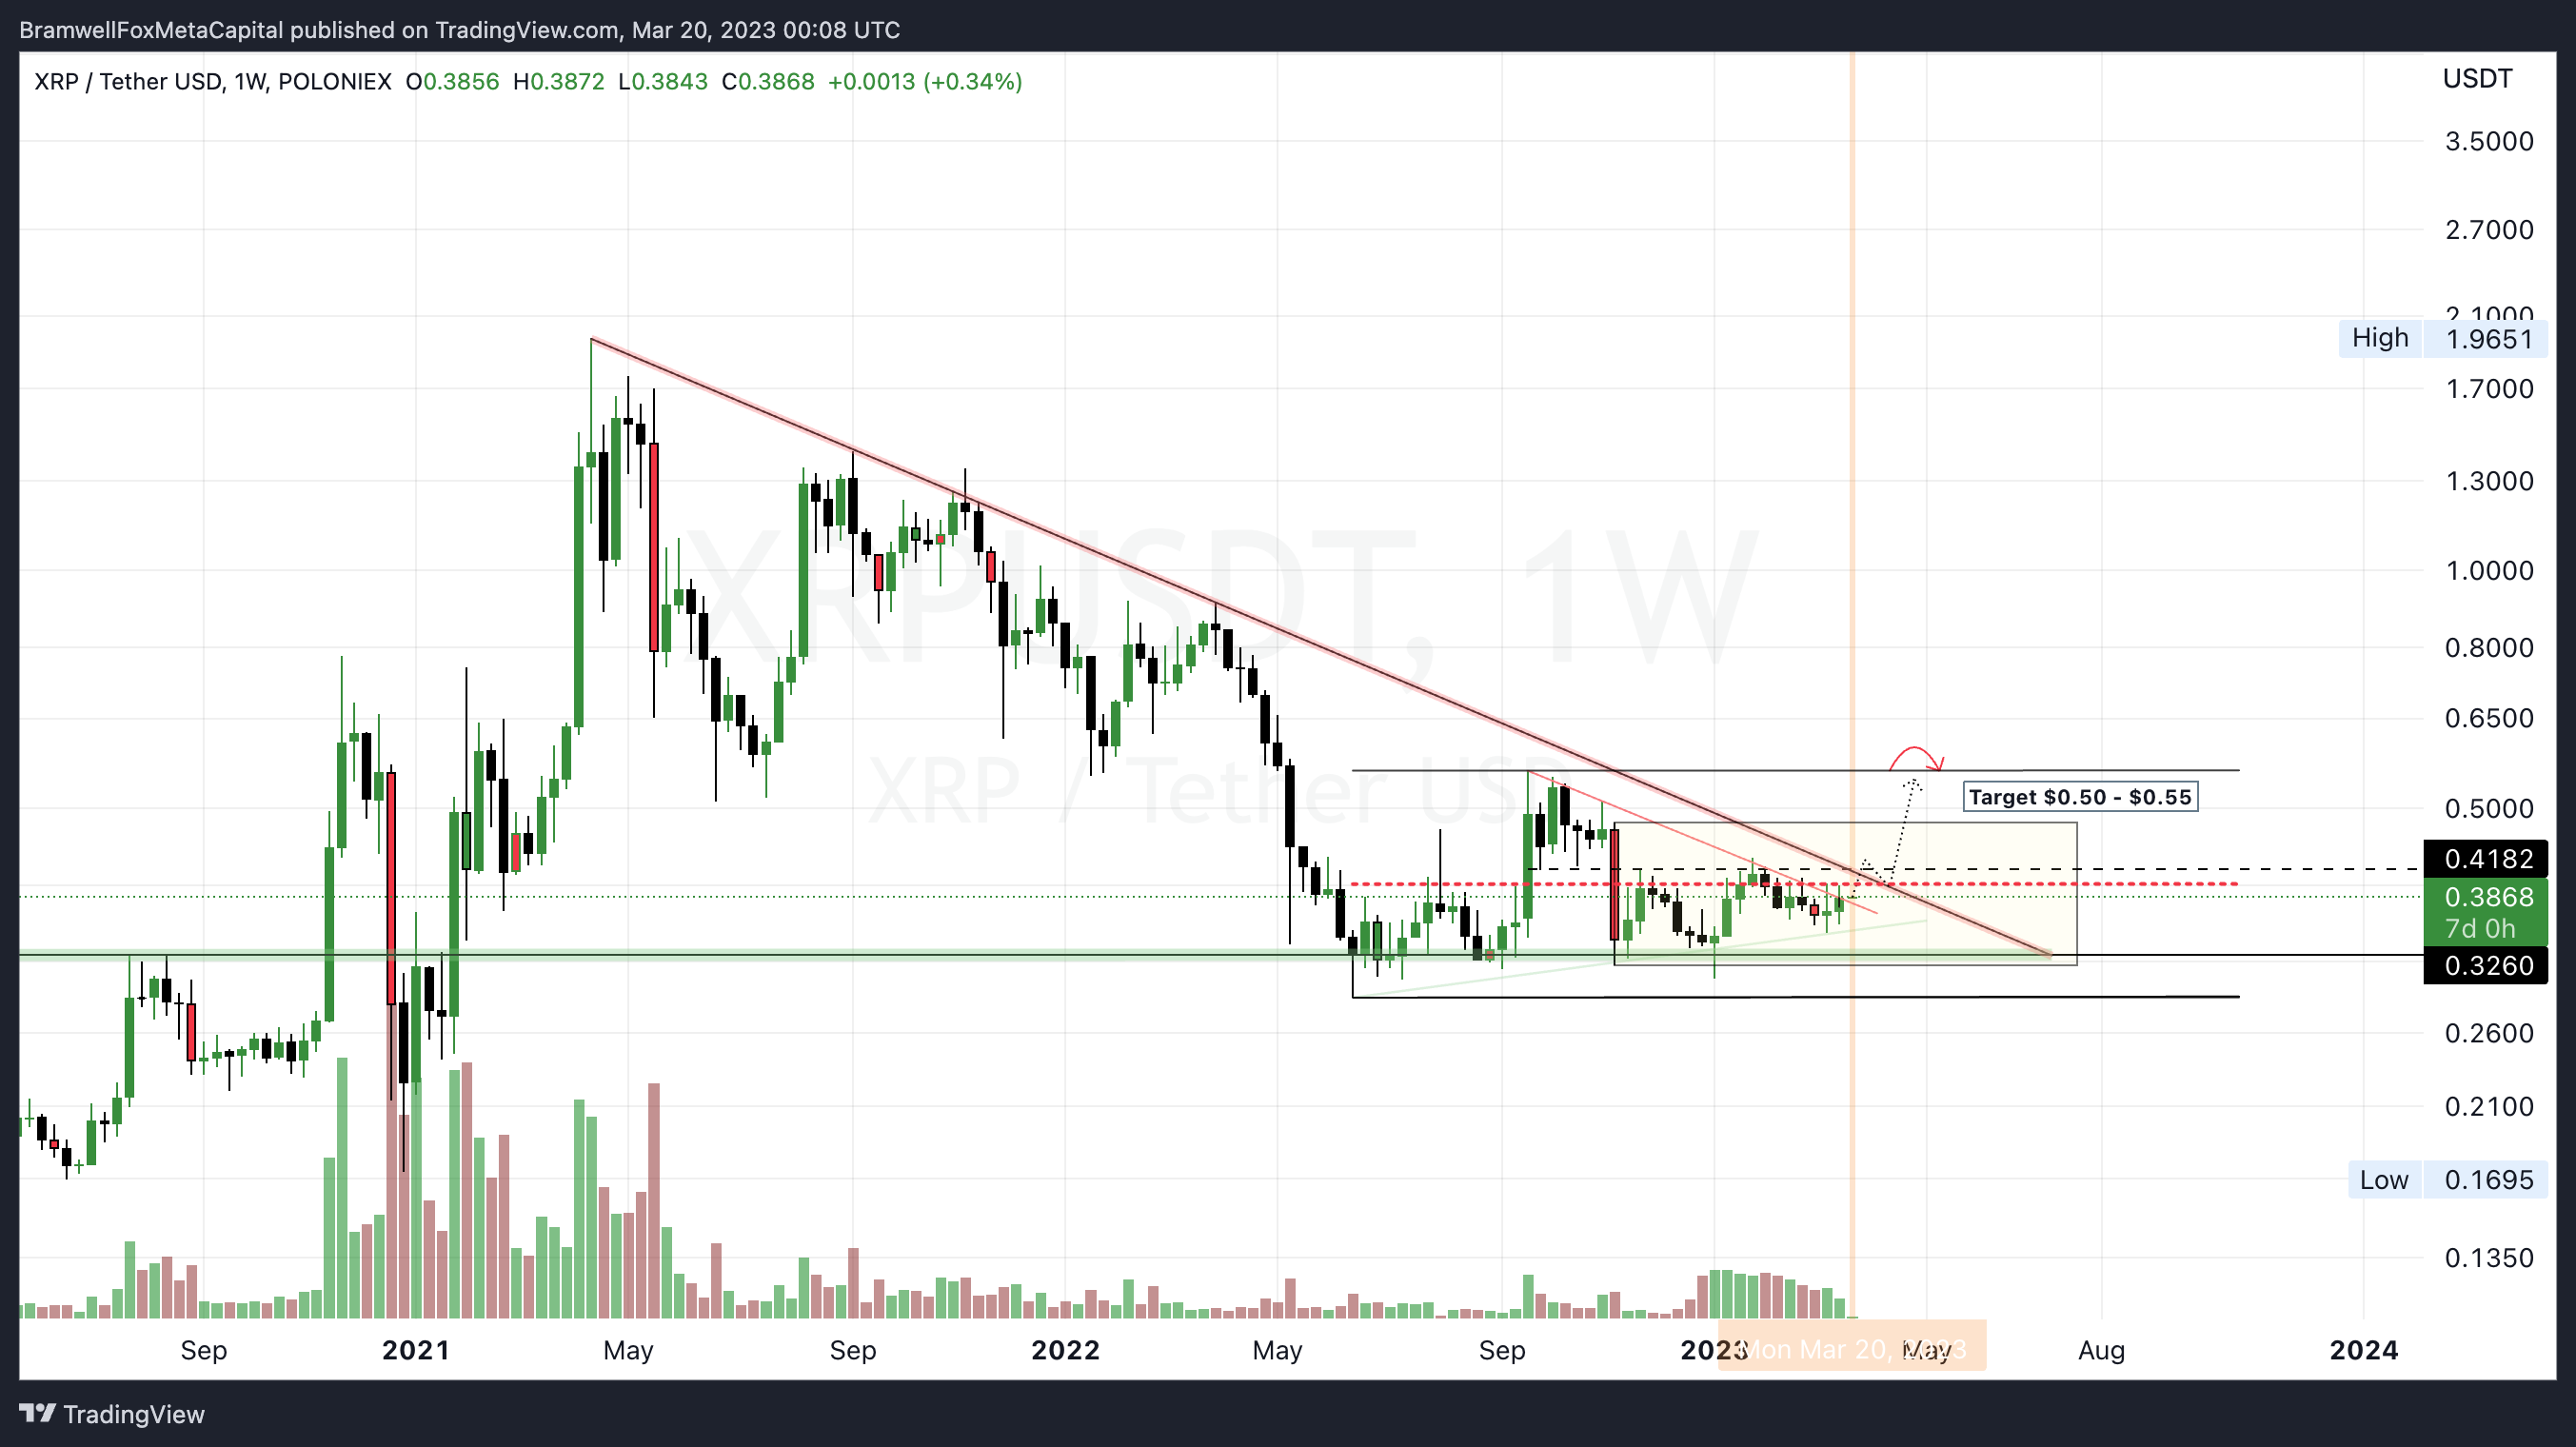
We're in the final stages of XRP's price pattern, and a breakout seems imminent.
The price has been consolidating within an inside candle since November 22nd, and I'm expecting it to test the range high soon, ultimately leading to a significant resistance breakout on the weekly timeframe.
This coincides well with the pending news surrounding the lawsuit SEC vs. Ripple.
It's fascinating timing, as XRP's primary use case is cross-border payments and on-demand liquidity. This is particularly interesting given the news over the weekend of a coordinated effort among central banks to 'increase' liquidity of the US Dollar, pending any further bank-runs or solvency crisis.
Sometimes when narratives line up like this, it feels like we're living in a simulation.
Featured Chart XRP 1W (click to enlarge photo)
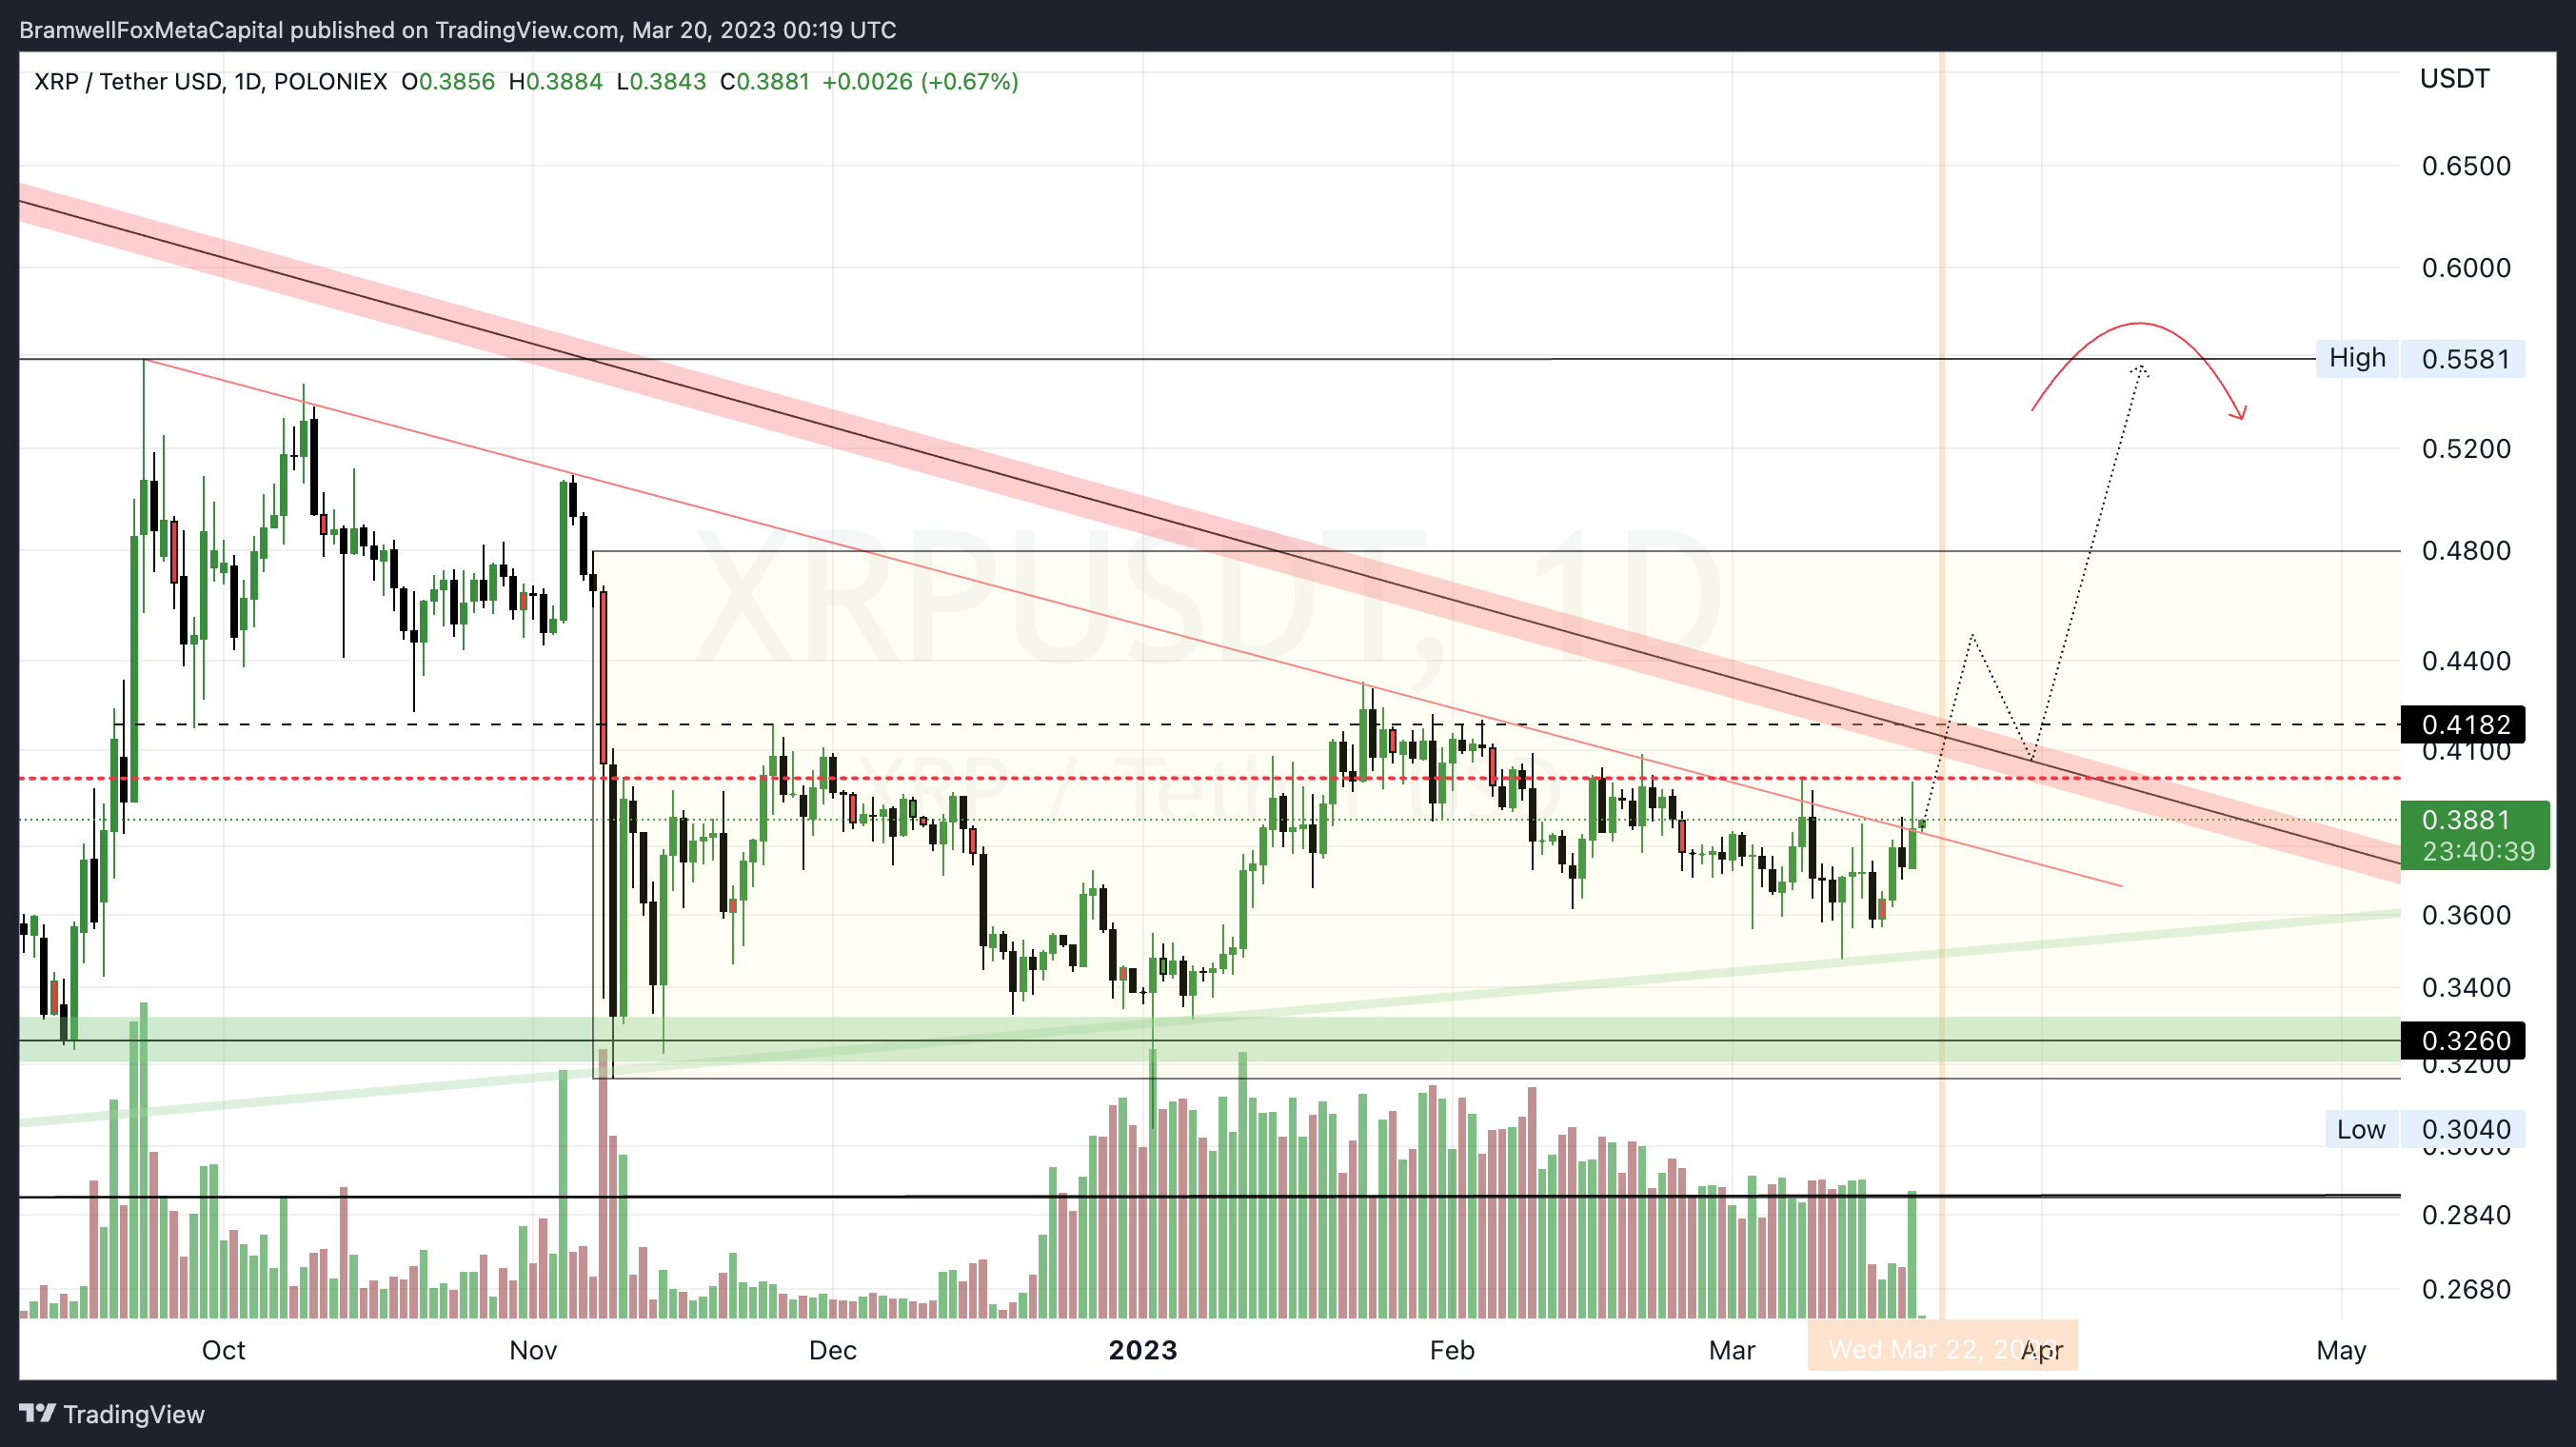
As we zoom into the daily chart, the important levels to consider are the pending breakout of the weekly range high's of $0.50 - $0.55.
We would then expect a retest of this diagonal resistance before retesting the supply areas upwards of $1.
Featured Chart XRP 1D (click to enlarge photo)
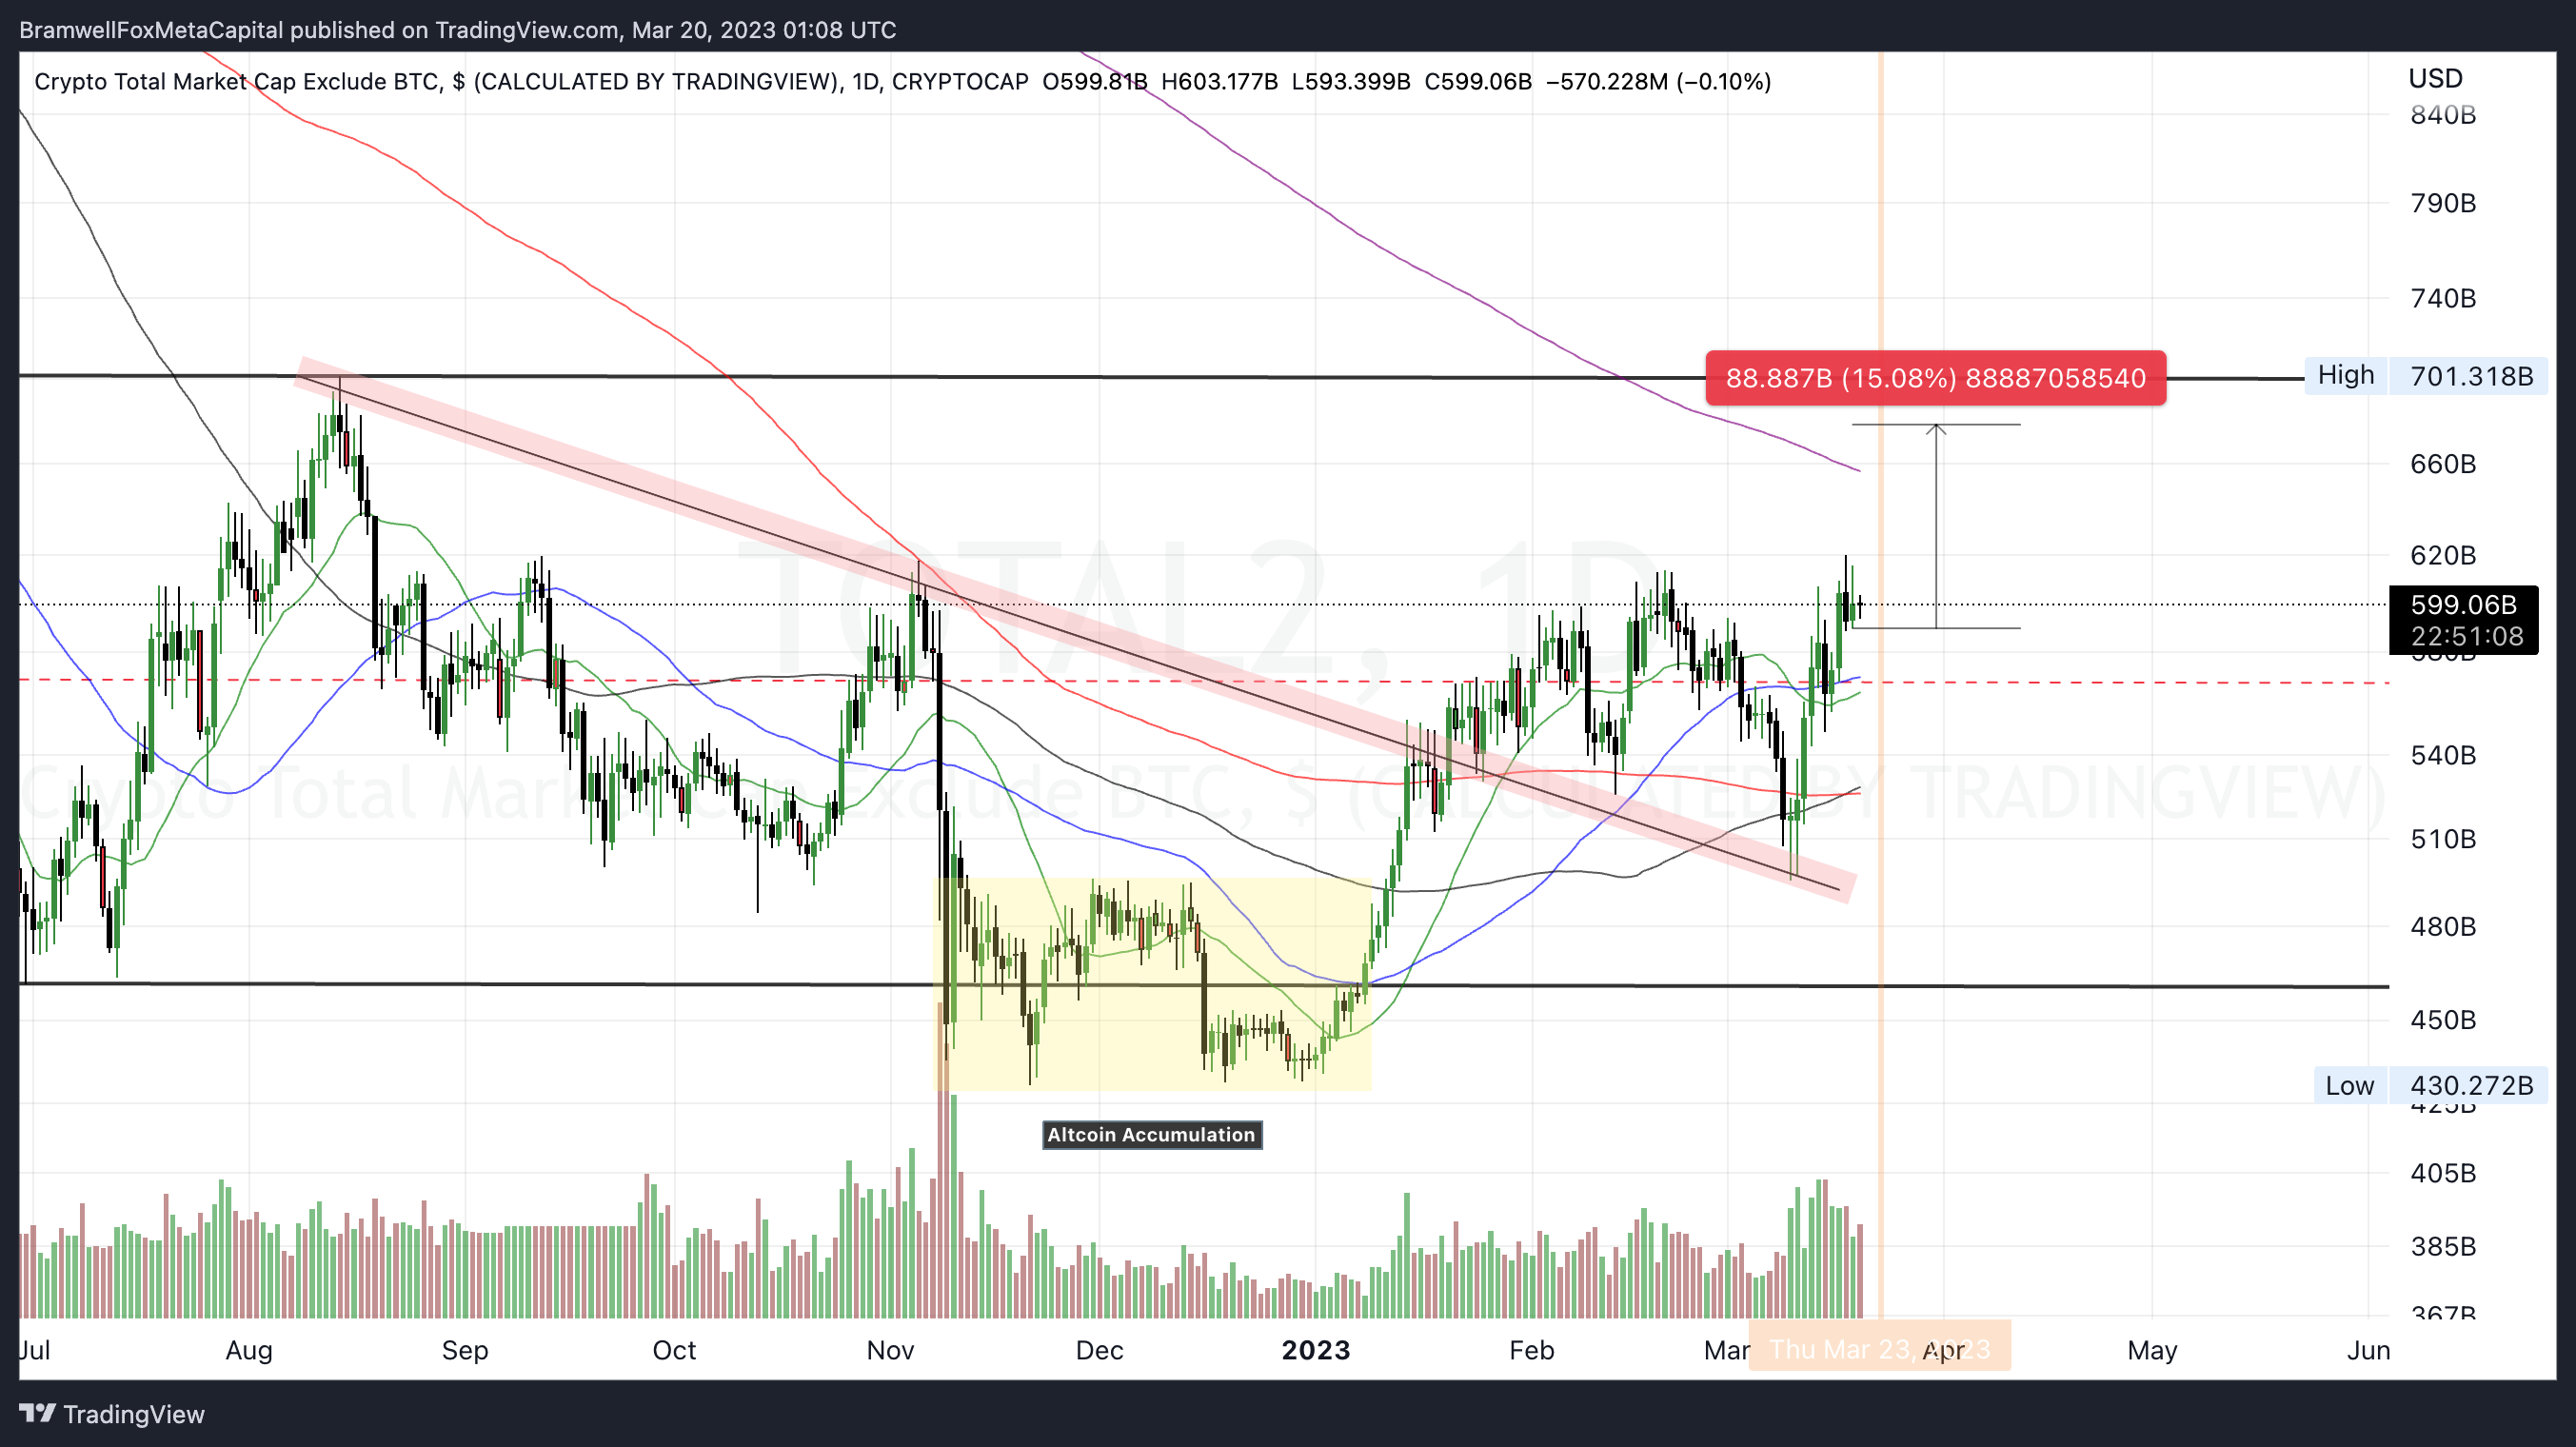
With Bitcoin potentially reaching a local top, investors may start looking for other coins that haven't seen significant price increases yet, leading to a possible rise in Total2, or the Alt-Coin Market Cap index.
This could result in a 10-15% increase in Total2 - so all eyes on Bitcoin Dominance to begin falling.
Featured Chart TOTAL2 1D (click to enlarge photo)
Commodities
📉 Oil + ⚖️ Gold & ⚖️ Silver
💬 Matthew’s Commentary, Analysis & Prediction for the Week Ahead:
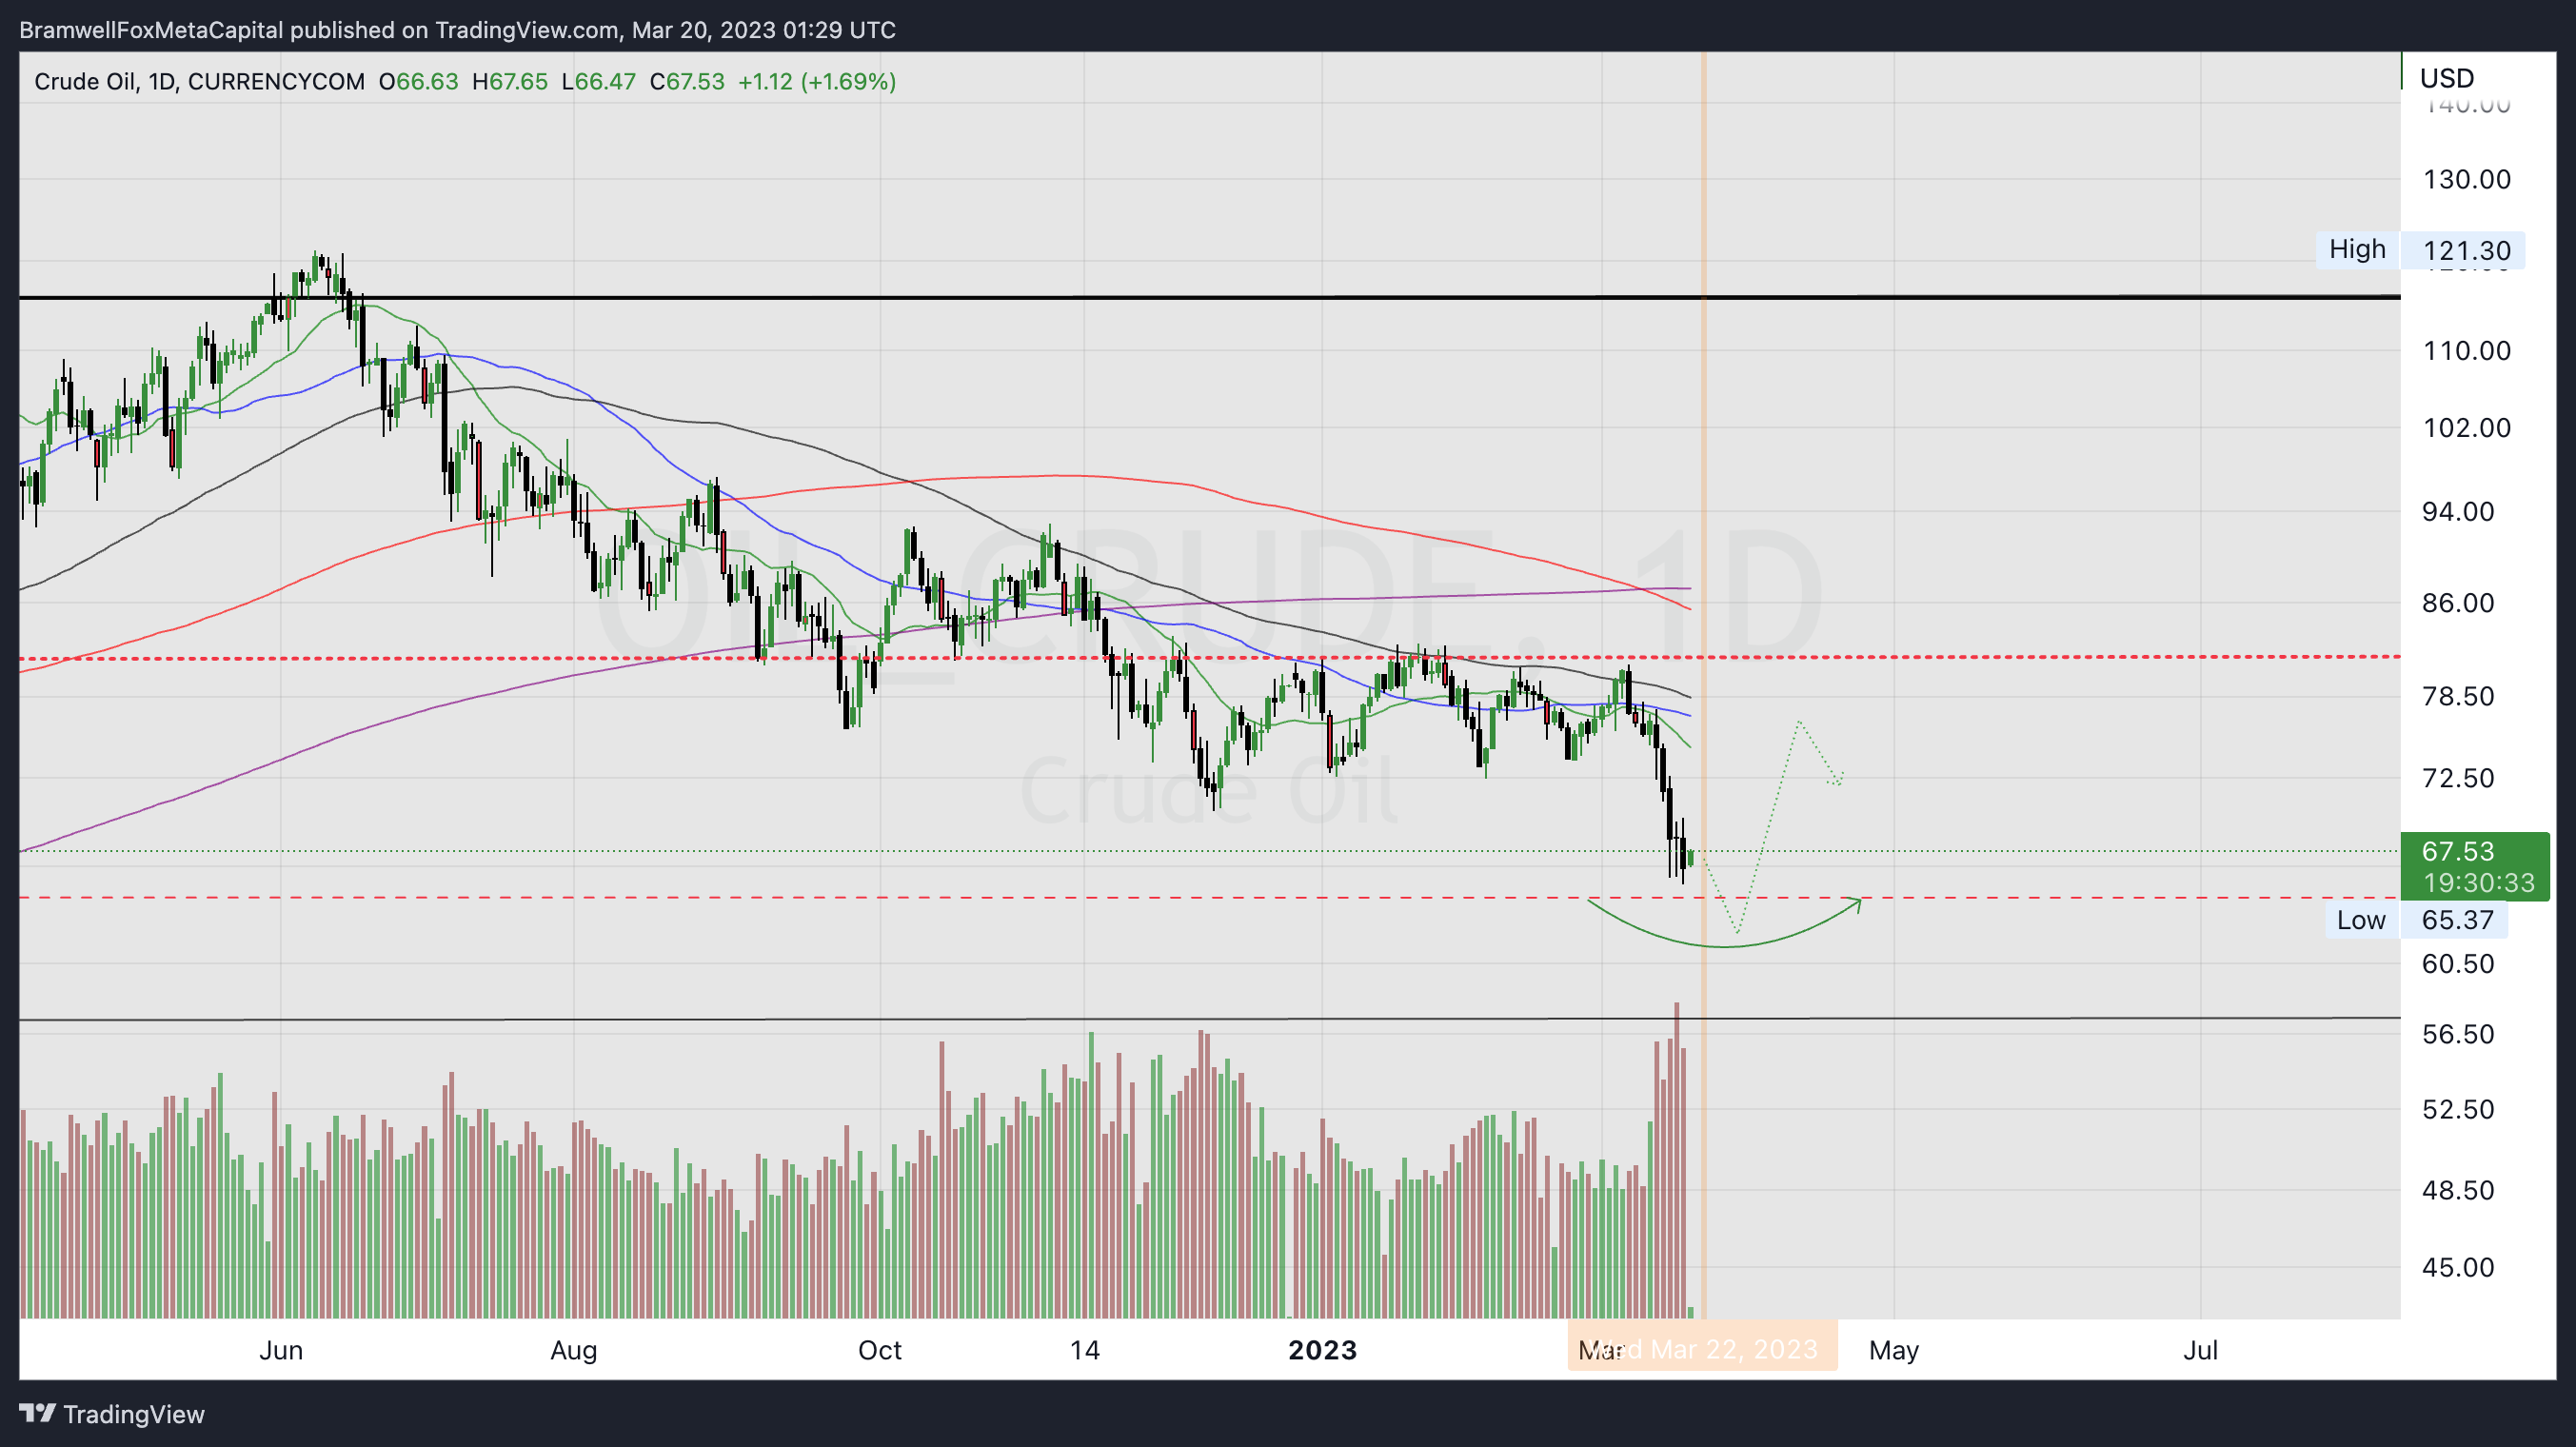
This fall, I started predicting that the price of oil would hit $65/barrel, and it has finally reached my expected level. I anticipate a brief period of consolidation in the near future, with oil prices ranging from $65 to $75 per barrel.
It's probable that investors are currently waiting to see the direction of the U.S. Dollar, as it will have a direct impact on the demand for oil.
Featured Chart Oil 1D (click to enlarge photo)
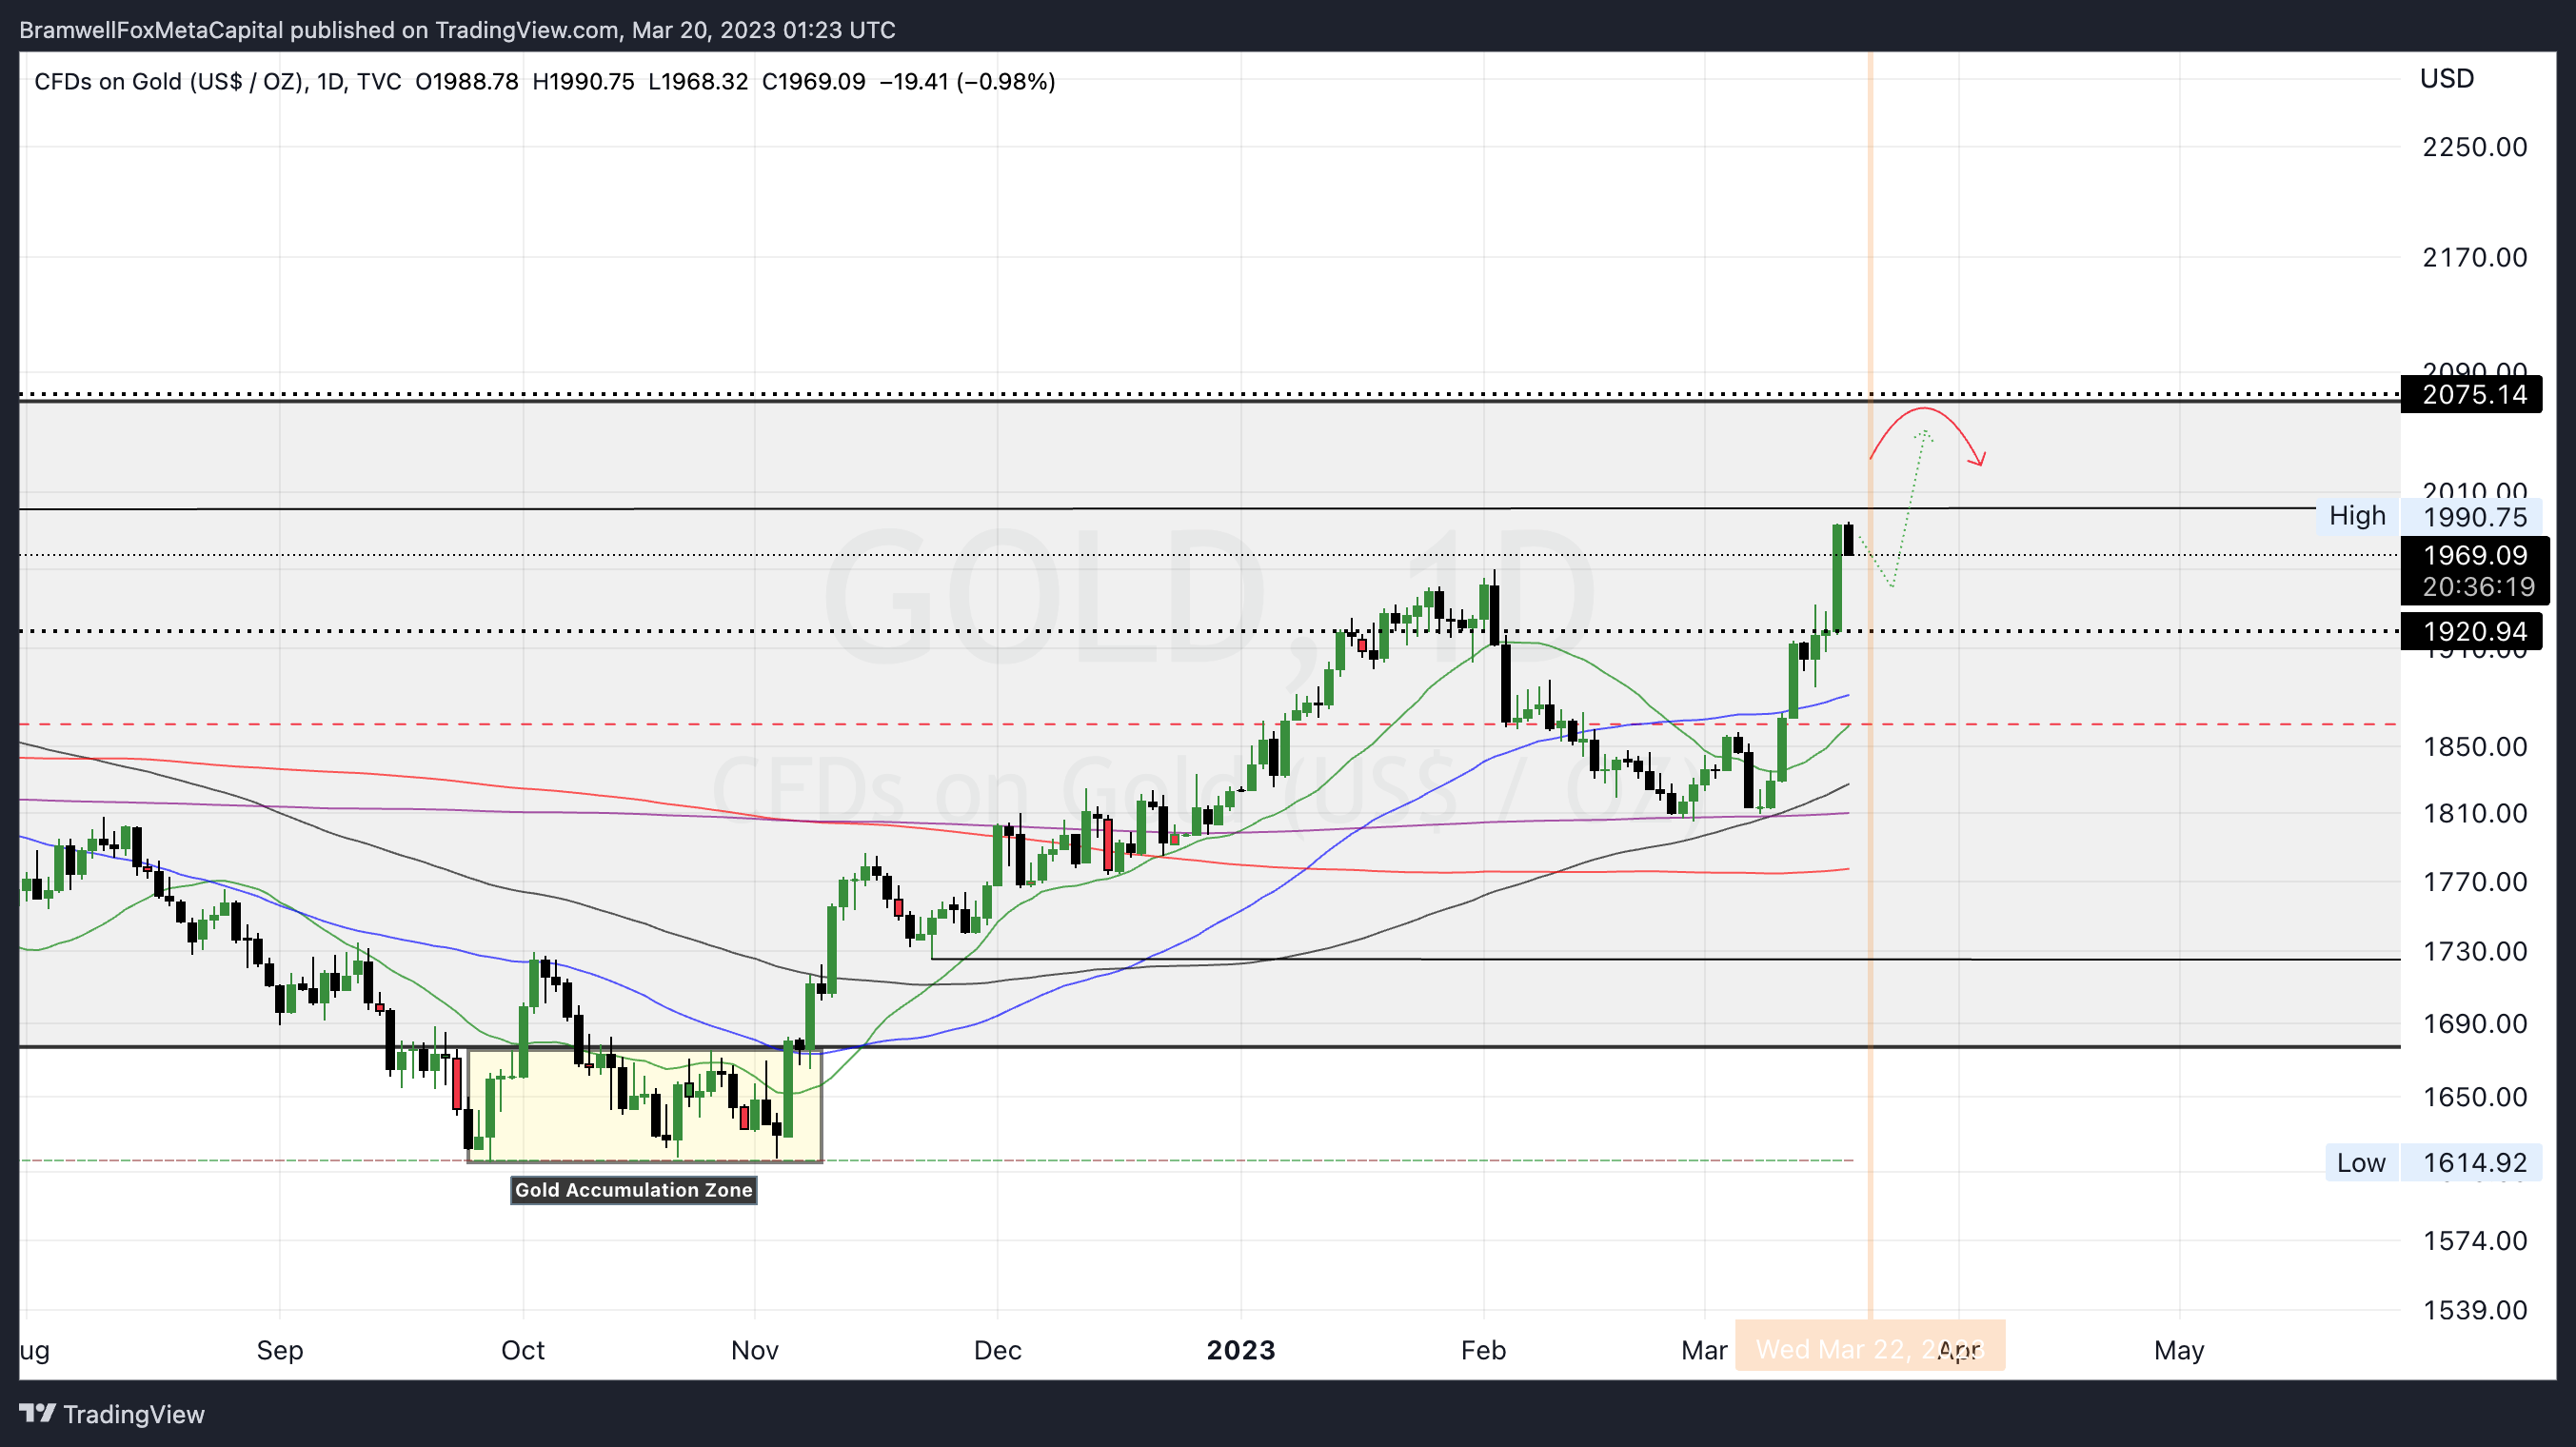
Gold has seen a tremendous rally and has reached prices near all-time highs per ounce.
As an inflation hedge asset, gold is expected to respond positively to any announcement from the Fed that rates may be paused or minimally increased.
If market participants begin to assume that the dollar will weaken or that central banks may need to inject more liquidity into the system to prevent system collapse, a rotation into metals is likely to occur.
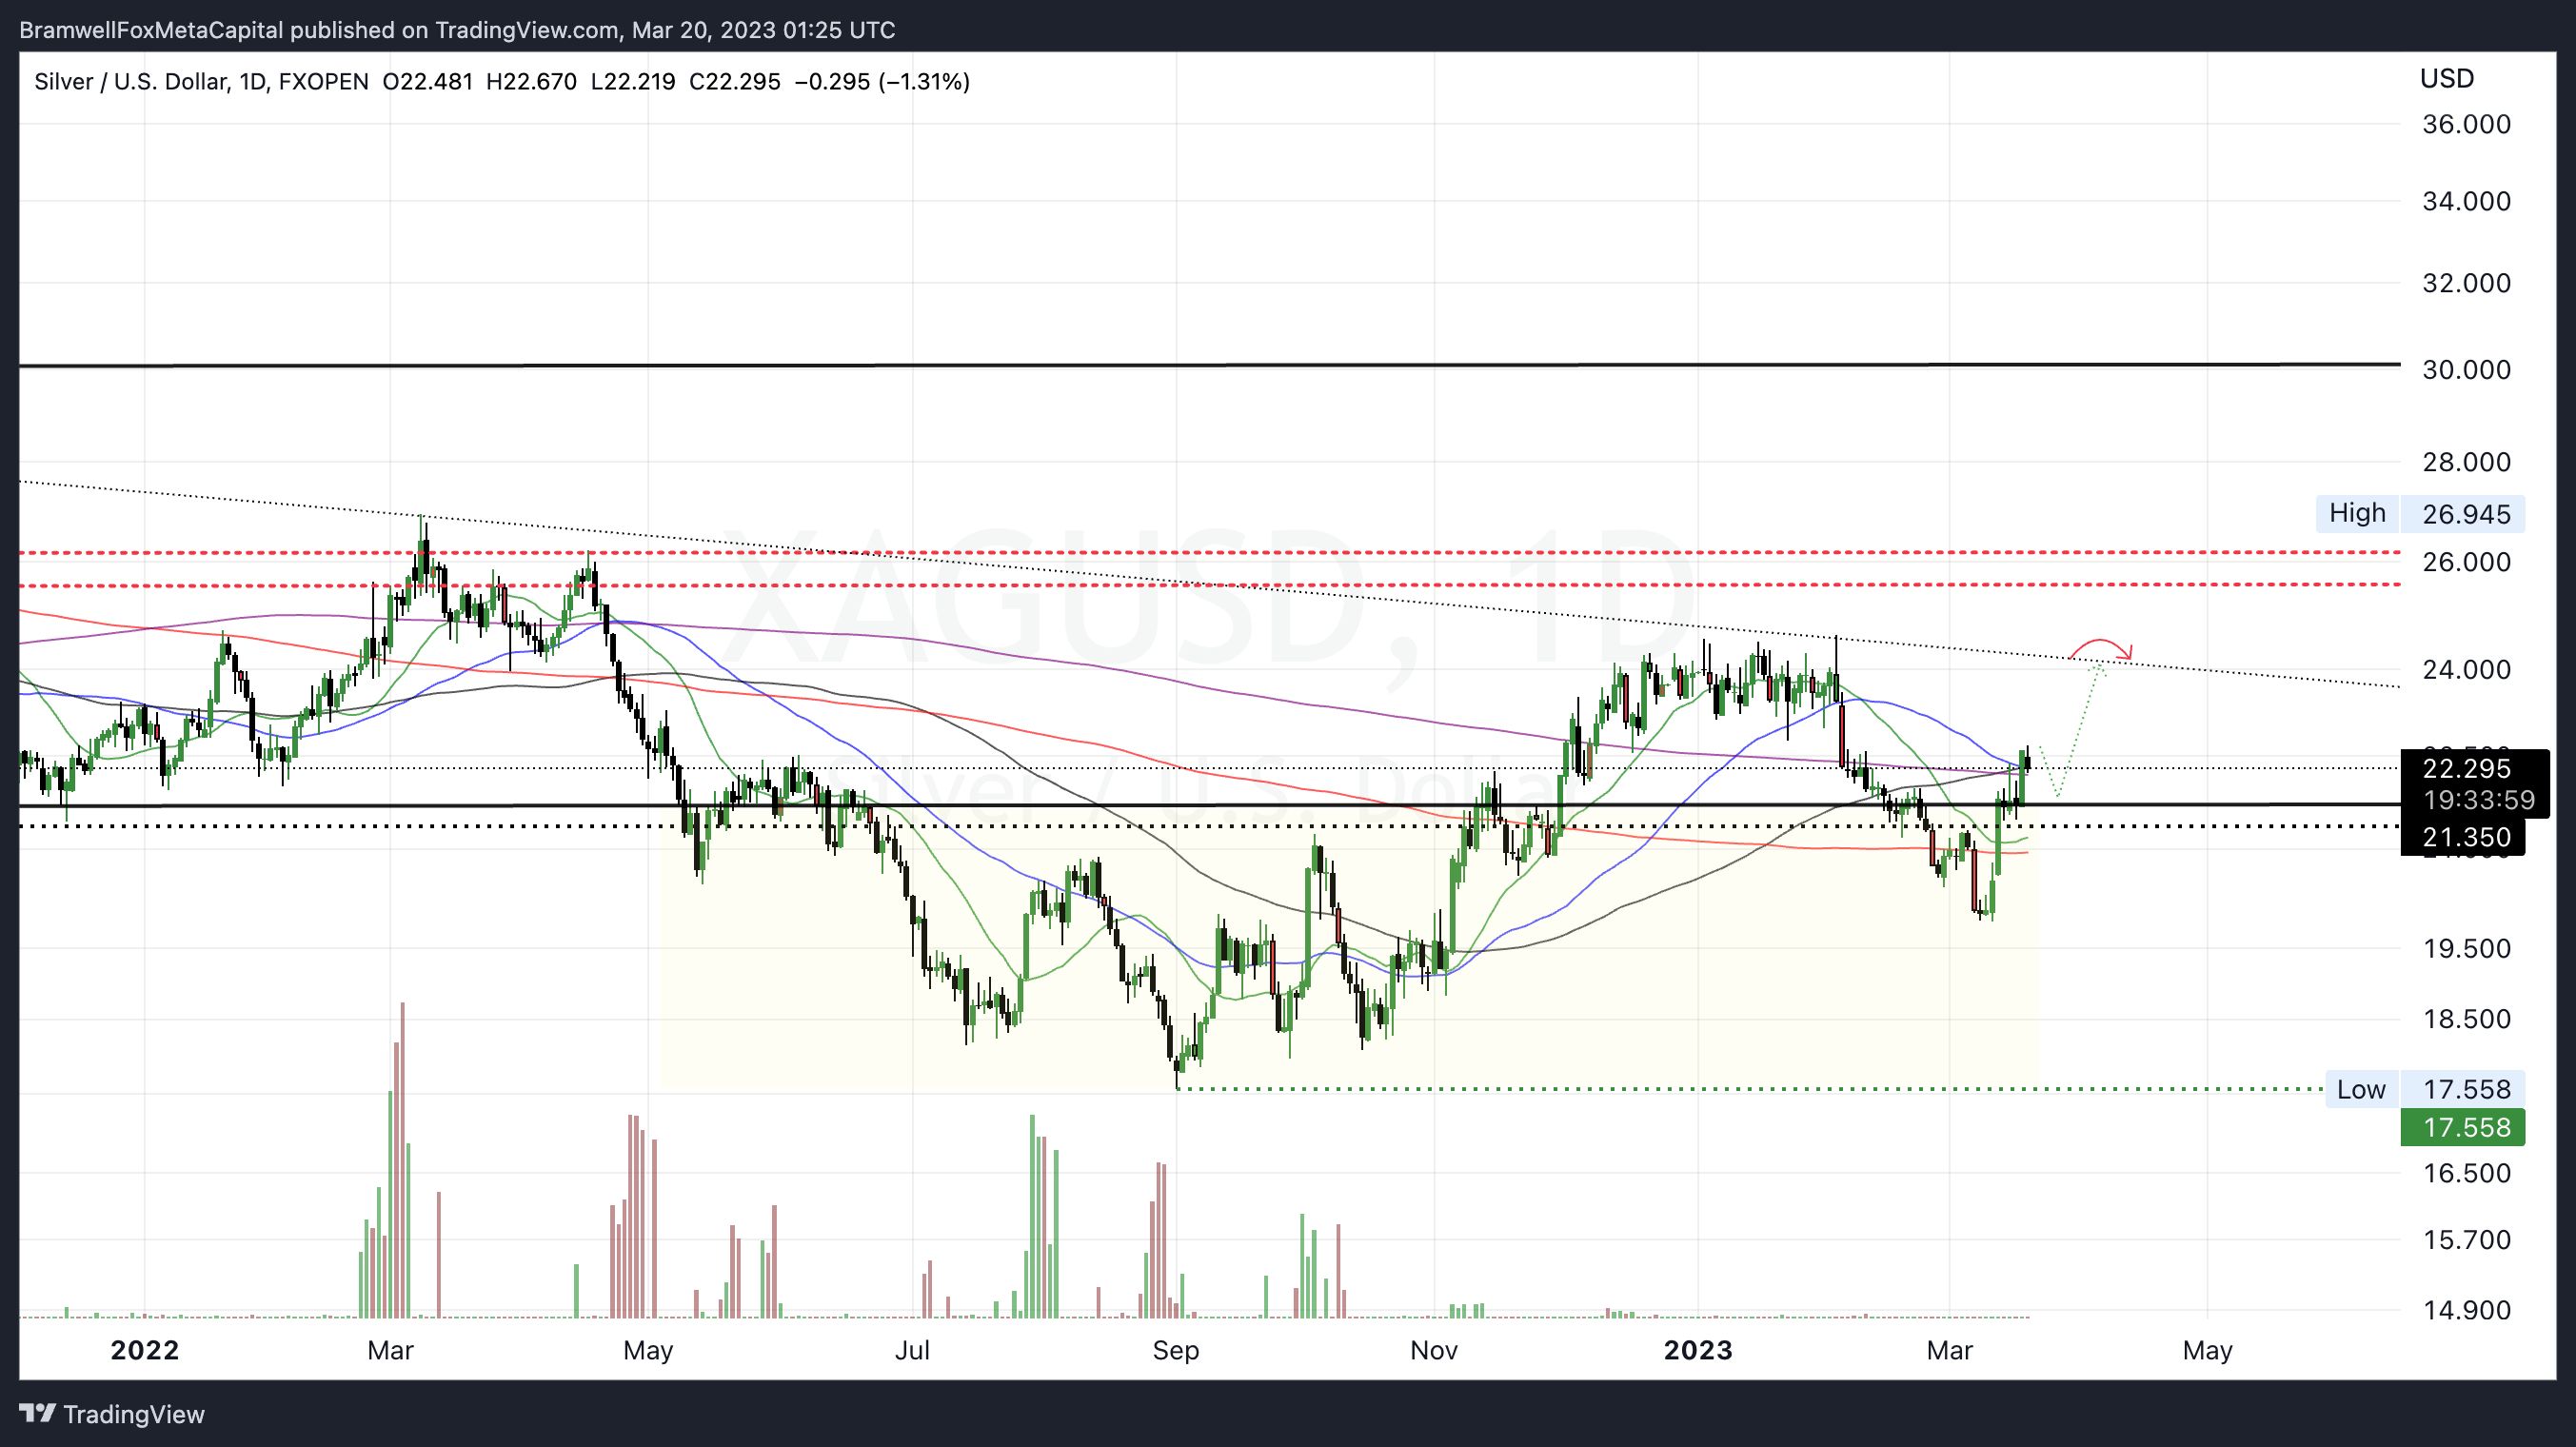
I am bullish on gold and silver, with price targets of $2050 per ounce for gold and $24 per ounce for silver. However, there may be a small pullback before these targets are reached, so dips in metals should be seen as an opportunity for aggressive spot buying.
It is important to note that a properly balanced portfolio should include a significant portion of metals to provide diversification and protection against market volatility.
Featured Chart Gold 1D (click to enlarge photo)
Featured Chart Silver 1D (click to enlarge photo)
👋🏼 Hey!
Thanks for reading this week's Weekly Market Update Edition No. 035
If you have any comments, feedback or questions on any material written in this edition please share as I'd love to continue a dialogue below.
If you enjoyed the read, I’d really appreciate if you’d share our community with your network of friends, family & fellow investors!