


🗞 Weekly Market Newsletter | Edition No. 26
News Update + A Full Analysis of Major Indices Including Stocks, Crypto, Commodities, Bonds & Forex


Sunday, January 15th, 2023
Hello Friends,
Don’t get too excited, but the charts do look good to start the year.
We’re just two weeks into 2023’ and off of a lower than expected CPI print this week for the U.S paired with slowing wage growth, a market rally has ensued.
What’s important to note is that major equity indices including the S&P500, Nasdaq, Dow Jones Industrial Average, Toronto Stock Exchange and for cryptocurrencies, Bitcoin, are all nearing (or in some cases broken out of) their bear market declining resistances.
In situations like these there are generally two camps of investors.
Those who anticipated lower low’s on asset prices are screaming that this is a short lived rally (dead-cat bounce) and we’re still headed lower due to economic headwinds and historic data showing further bearish projections. They argue this is institutional money driving up the price of assets to induce ‘FOMO’ in order to produce their exit liquidity.
Those who believe this was the market bottom (accumulation phase) and that institutional liquidity is front-running retail investors, driving up the price of growth assets meanwhile retail is left on the sidelines sitting on cash or having capitulated out of fear - and sitting on no positions at all.
If those two camps represent the far-bearish and far-bullish, I’m arguably somewhere in the centre right of bullish.
My two perspectives are these;
The technicals (think charts with funny lines) of most major risk indices are all showing historic oversold indicators and many of them are showing strength as they approach their resistances.
I do believe these assets and indices will breakout of their downtrends and begin creating high timeframe trading ranges (consolidation ranges) as economies heal from the events of recent years and markets begin increasing their appetite for risk.
The fundamentals of the major economies are slowly turning around.
Important economic datasets are showing a decline in the rate of change on soaring prices, rising unemployment claims, decreases in housing / rental costs as well as declining energy costs.
What we can derive from both of these perspectives is not necessarily a bullish euphoria as much as a window of opportunity for risk based investments to experience a liquidity rotation out of defensive and or short positions.
The single caveat, or achilles heel, to a full blown bull run remains hidden in the movement of treasury (bond market) yields.
Currently as it stands the US 2-Year yield is over 4% meanwhile the 10-Year is trading 3.5% which prints an inverted yield curve typically leading to a recession.
…and isn’t that the new fad word, recession, that major organizations such as the World Economic Forum, IMF and every economist under the sun have been warning us about for months now?
If so, then our window of opportunity to take profits off the table may be short lived, perhaps a few weeks to a few months.
However, should the yield curve steepen from here and the 2-Year fall below the 10-Year yield, we may see that window of opportunity lengthen into 2024 as the recession-talk may have been too cheap.
It’s important that we remember that the U.S Presidential election ought to be the event of the decade sending world markets into a frenzy no matter the outcome.
The United States has been rocked by threats to its democracy from the inside out, a culture war, fiat currency devaluation and soaring debt. It feels unlikely that the privilege of owning the world’s reserve currency will remain in the hands of a nation so plagued by its own greed and arrogance which begs the question - who’s up next?
To sum up this short epilogue, between now and 2024 I believe we will experience mild to moderate growth in risk, which may bring some assets such as Bitcoin and major equity indices to new high’s due to corrections in the strength of fiat (cash) yields and increased investor risk for growth oriented investments with an 18-24 month timeframe.
All eyes on the FOMC meeting in just a few weeks from now where markets will react to further interest rate hikes expected to be anywhere from nil to 25 basis points.
This event will be our first milestone in projecting the strength of any bullish momentum being generated in these early weeks of 2023’, from there we will adjust our portfolios accordingly.
Enjoy the edition,
- Bramwell
ps. make sure you cast your vote on the community poll for our next ‘Ask A.I’ series episode - I’ve added a few or you may leave a comment with your idea!
📊 Fox MetaCapital’s Community Poll
💡Add your idea for the next ‘Ask A.I’ episode.
📰 Fox MetaCapital’s Weekly News Recap
You may press the 🗞 to read more about each headline.
Major News + Crypto Headlines
🗞 U.S Economic Data: Lower CPI Print Sparks Rally + Jobless Claims Flat but Wage Growth Declining
💭 Matthew’s Thoughts…
Life is getting cheaper in slow motion.
(That’s sort of a funny joke, but not really.)
Just as the year started with a favourable CPI print the markets began front running risk assets in anticipation of the impending FED pivot on interest rates.
With no FOMC meeting until the end of January the markets are gathering their positions in advance of a rate pause or marginal rate hike in the 25 basis point range.
Had CPI missed or exceeded expectations, the markets may have been more cautious of a guaranteed 25 basis points with room for 50 bps on the line.
and yet it’s still a possibility, just less likely.
Remember, the FED (FOMC) uses a variety of economic data to make decisions about monetary policy. This data includes information on inflation (CPI), (un)employment, gross domestic product (/GDP +/-) and consumer spending (or in other words, savings reserve) as well as a few other indicators of economic activity.
Thus investors are incentivized from a risk management standpoint to chase the maximum yield by speculating and taking positions at the earliest signs of a shifting monetary policy tone.
All eyes on the February 1st FOMC from here.

🗞 Forecasting GDP & Economic Activity - which sector will lead?
💭 Matthew’s Thoughts…
If we are given a short-medium timeframe window of opportunity for growth in the economy, it’s worth asking yourself the question of which sectors will lead?
A great activity would be to mentally calculate where the majority of your own discretionary spending is being spent and where you forecast your spending or investing habits to change throughout the year.
For example, in 2022 consumers cut back drastically on the amount of app’s they subscribed to as well as buying items like clothing and electronics.


Due to soaring unemployment and rising cost of goods, consumers doubled down on simply covering their bare essentials meanwhile credit lines and credit cards began accumulating balances which drove up interest rate revenue for banks.
This year it appears the housing market may begin to sharply decline and banks may take a hit on bad loans and bankrupt consumers, how may this problem cascade? We will see.
Furthermore, with supply chains re-opening globally it’s possible that the manufacturing sector may begin to experience higher growth meanwhile the energy sector may revert to their mean yield from previous years should energy costs decline YoY%.
What do you forecast?
🗞 Mo Money, Mo Problems = No Money, No Problems 😅?
💭 Matthew’s Thoughts…
The primary reason I sit centre right of a bullish bias orbits this piece of data - consumer savings and the rate of savings are at the lowest levels since 2007.


This is not good.
For an economy to experience growth requires a stimulation of consumer and corporate spending alongside a steepening rate of savings.
This means that we need a widening gap between expenses vs. income - not a narrowing one.
While CPI data printed a marginal (if not insignificant) decline, it’s important to step back and realize that inflation is still above 6% per year.
The longer that interest rates and costs remain high, the slower and more painful a death of the lower and middle class who make up a huge % of the economy.
Generally speaking the lower and middle classes have less assets to liquidate or draw liquidity from to cover rising fixed costs. At best current economic conditions are creating a mental health disaster due to the stress, at worst we could see an 08’ style domino effect should bankruptcies and defaults begin to pile up.
I’m carefully monitoring consumer spending and GDP data to hedge correctly against this potential black swan scenario.
🗞 Out with Income Tax and in with…Consumption Tax?
💭 Matthew’s Thoughts…
One of the greatest books I’ve read on the possible future direction of our global economy was Capital in the 21st Century written by Thomas Piketty.
His years of research on the changing tides of capitalism lead to a lukewarm recommendation of a new system of taxation revenue generation by world governments by imposing an international, progressive, Wealth Tax.
You can imagine my spidey-senses were tingling when I came across this headline earlier this week that U.S Republicans were proposing an abolishment of the IRS and Income Tax.
While I ultimately expect this specific bill to be veto’d, the most important silver lining here is that these types of conversations are now happening across the world. In high levels of government, leaders of major nations are now realizing our current financial system is broken. Very soon the soaring global debt in fiat denomination will eventually render the world sterile of meaningful liquidity.
A new blueprint must be drafted for how nations raise and distribute units of economic value, and in my opinion the solution will be blockchain technology and Central Bank Digital Currencies.

🗞 Does ChatGPT mark the beginning of a new world order?
💭 Matthew’s Thoughts…
I really do have the audacity to make such a claim.
In my opinion artificial intelligence is having its watershed moment.
Very soon the logic behind ever using ‘Google’ will be outdated and even the concept of ‘human learning’ could be redefined.
Some questions immediately come to my mind:
Why require a young human to remember things in school when the perfect answer is a click away?
Will there be a shift from remembering to applying?
Why hire a human to do a task when a software is arguably more efficient?
Will the labour market be forced into irrelevancy in the coming decades?
How will A.I integration affect the bottom line of many companies in the coming decades?
How will A.I change our way of living & interacting with each other?
I have so many questions on what’s next for technology, but one thing I do know is that Microsoft is writing a $10B cheque to be the first to find out.

🗞 SEC continues Warfare vs. Centralized Actors / Exchanges
💭 Matthew’s Thoughts…
It wouldn’t be a normal week in crypto without the Bad Boys of Regulation, the SEC, coming for you(r) crypto.
This week, the SEC launched a case vs. the famous Winklevoss Twins (they founded Gemini) and Genesis Global over their crypto lending operations.
It appears that the SEC is attempting to bottleneck the liquidity in the crypto market by going after major exchanges who provide custodianship and yield to everyday crypto users.
Is this to ‘protect’ investors or to protect their banking buddies on Wall St.?
You tell me.

🗞 Connect Everything. Flare Networks is officially live.
💭 Matthew’s Thoughts…
After 2 years of anticipation, one of my favourite blockchain networks has officially launched their main-net, Flare Networks is now live.
Flare promises to unlock the value of idle Layer 1 blockchains (such as XRP, XLM, Litecoin & Doge) by allowing interoperability atop of their Smart Contract enabled network.
Flare is aiming to solve the network-network bridging problem that has plagued the industry due to bridge hacks and infrastructure failures.
After the success of their test network launch of Songbird in 2021, the team officially completed their initial 15% airdrop of FLR tokens on Monday to token holders who were a part of the snapshot in late 2020.
These token holders will now go to vote this week on an important proposal that may change the existing token distributing scheme initially drafted by the Flare team.
In the new proposal, FLR token holders will be incentivized to wrap and delegate their FLR tokens for up to 36 months, helping to further decentralize the network meanwhile receiving more FLR tokens than the initial scheme was structured to unfold.
In the coming months we should see more announcements from the FLR team as development picks up on the network with more d’apps being launched and utility being driven into Flare by the many ecosystems they connect.

Fox MetaCapital’s Weekly Asset Review + Technical Analysis
📈📉 The Week Ahead in Charts
Symbols 📈 or 🐂 = Bullish / Positive | 📉 or 🧸 = Bearish or Negative | ⚖️ Ranging or Low Volatility
FOREX
📉 DXY U.S Dollar (🎯 Target 101) + 📈 CAD (🎯 Target .76)
💬 Matthew’s Commentary, Analysis & Prediction for the Week Ahead:
The DXY continued its slump last week closing the week just shy of 102.
As we can see in the 3D featured chart below, the DXY is sitting atop of a monthly fair value gap (an inefficiency in its price history) and my bets are that between now and March we may see a wick into the 100’s or high 90’s before a breakout / mean reversion is attempted into the yearly open.
It’s encouraged to be cautious at these levels as the DXY is technically sitting closer to high time frame range support than resistance, providing a discounted risk for traders to enter into positions.
In addition, we can gather further confluence of a DXY bounce as the technicals are oversold across all indicators.
I’m expecting marginal volatility in the weeks and months ahead as DXY should form a high time frame trading range with activity increasing close to the FOMC events in February and March.
As the phrase goes, Sell-in-May-and-Go-Away may be the mantra should the scenario below play-out.
Featured Chart DXY 3D (click to enlarge photo)

Zooming in on the 1-Day chart we see the possible path the DXY may take while crossing the channel and potentially breaking out of the downtrend that began in late November.
Typically, risk asset price fluctuations will be inversely correlated with any spikes in the DXY.
Featured Chart DXY 1D (click to enlarge photo)

As for Maple Leaf Coin, it’s chugging along.
The Canadian Dollar has gained some ground against the U.S Dollar in recent weeks and I’m expecting further upside in the coming weeks.
Should the CAD continue its uptrend through the channel I believe it will takeout the Bearish Order Block liquidity and attempt a reclaim of the .76 region (red zone).
Featured Chart CAD 1D (click to enlarge photo)

Equities
📈 S&P500 (🎯 Target 4,100) + 📈 TSX (🎯 Target 21,025)
💬 Matthew’s Commentary, Analysis & Prediction for the Week Ahead:
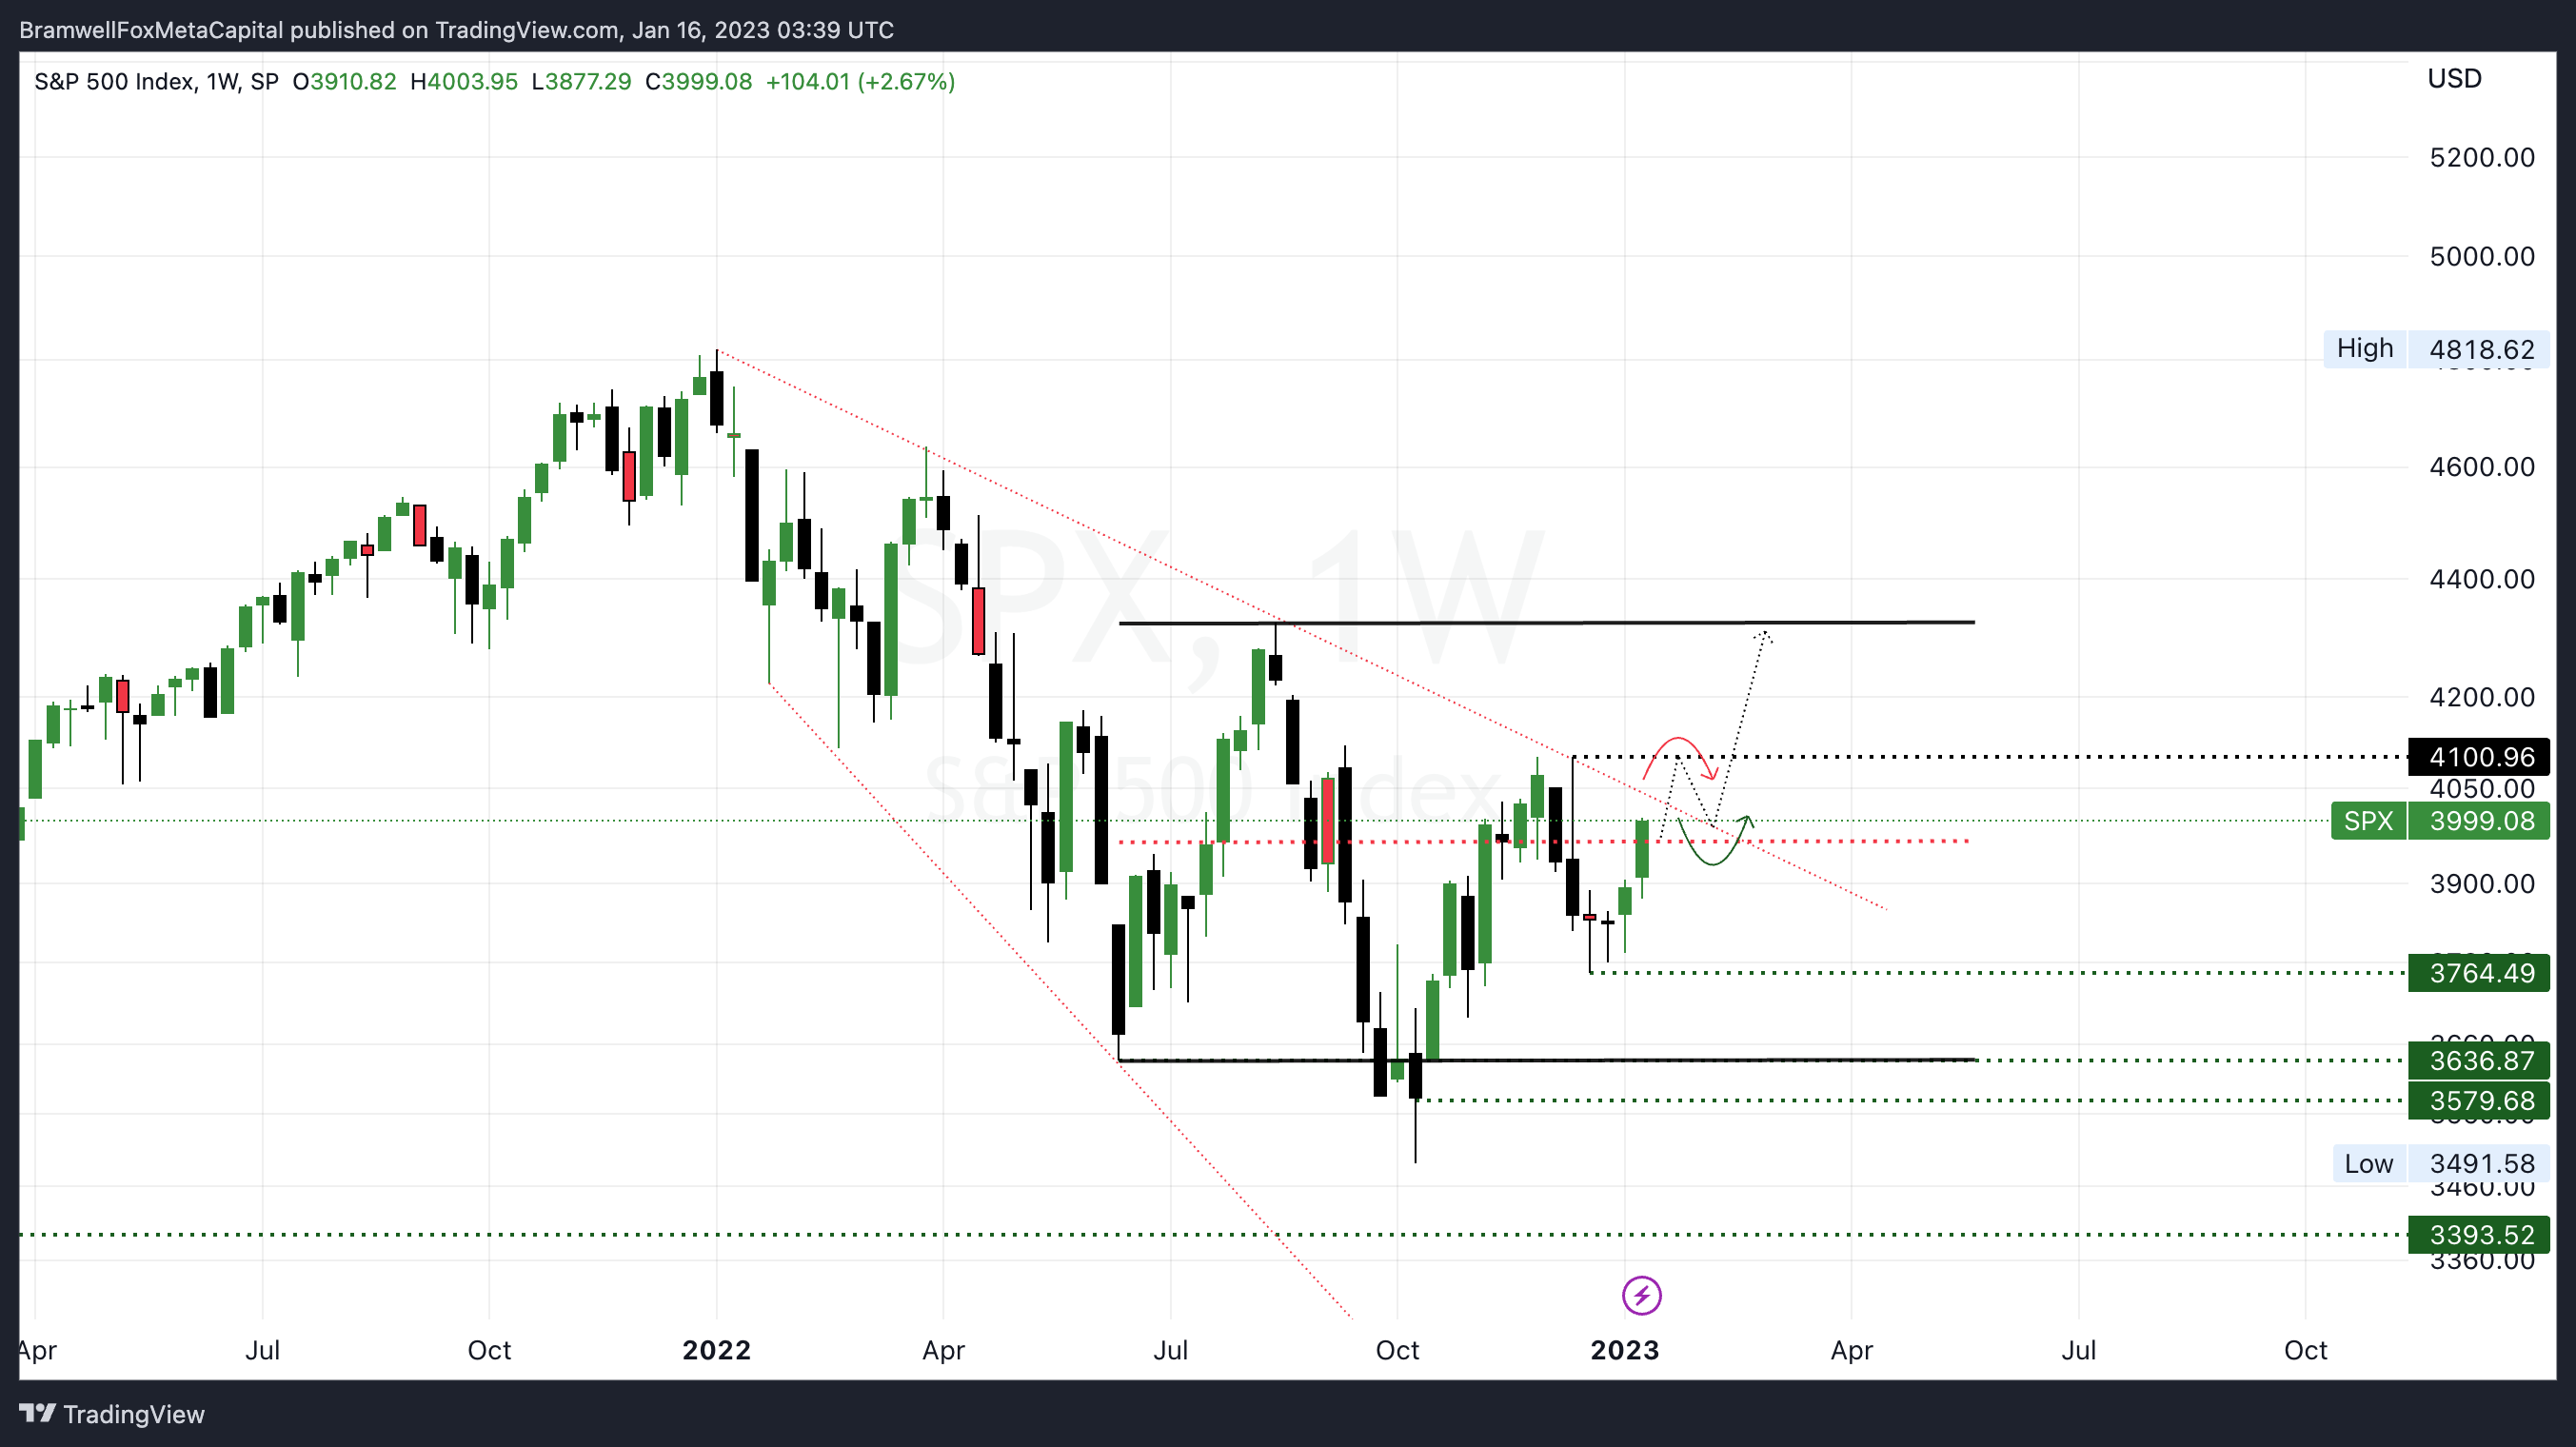
The question on everyone’s mind - is this a fake-out and or bull-trap?
The S&P500 printed a bullish candle last week and will make an attempt this week at breaking out of its bear market downtrend.
Should a breakout occur, my SPX targets are ~4100 before the index backtests the diagonal resistance and claims support before a further move upwards is possible.
Featured Chart S&P500 1W (click to enlarge photo)
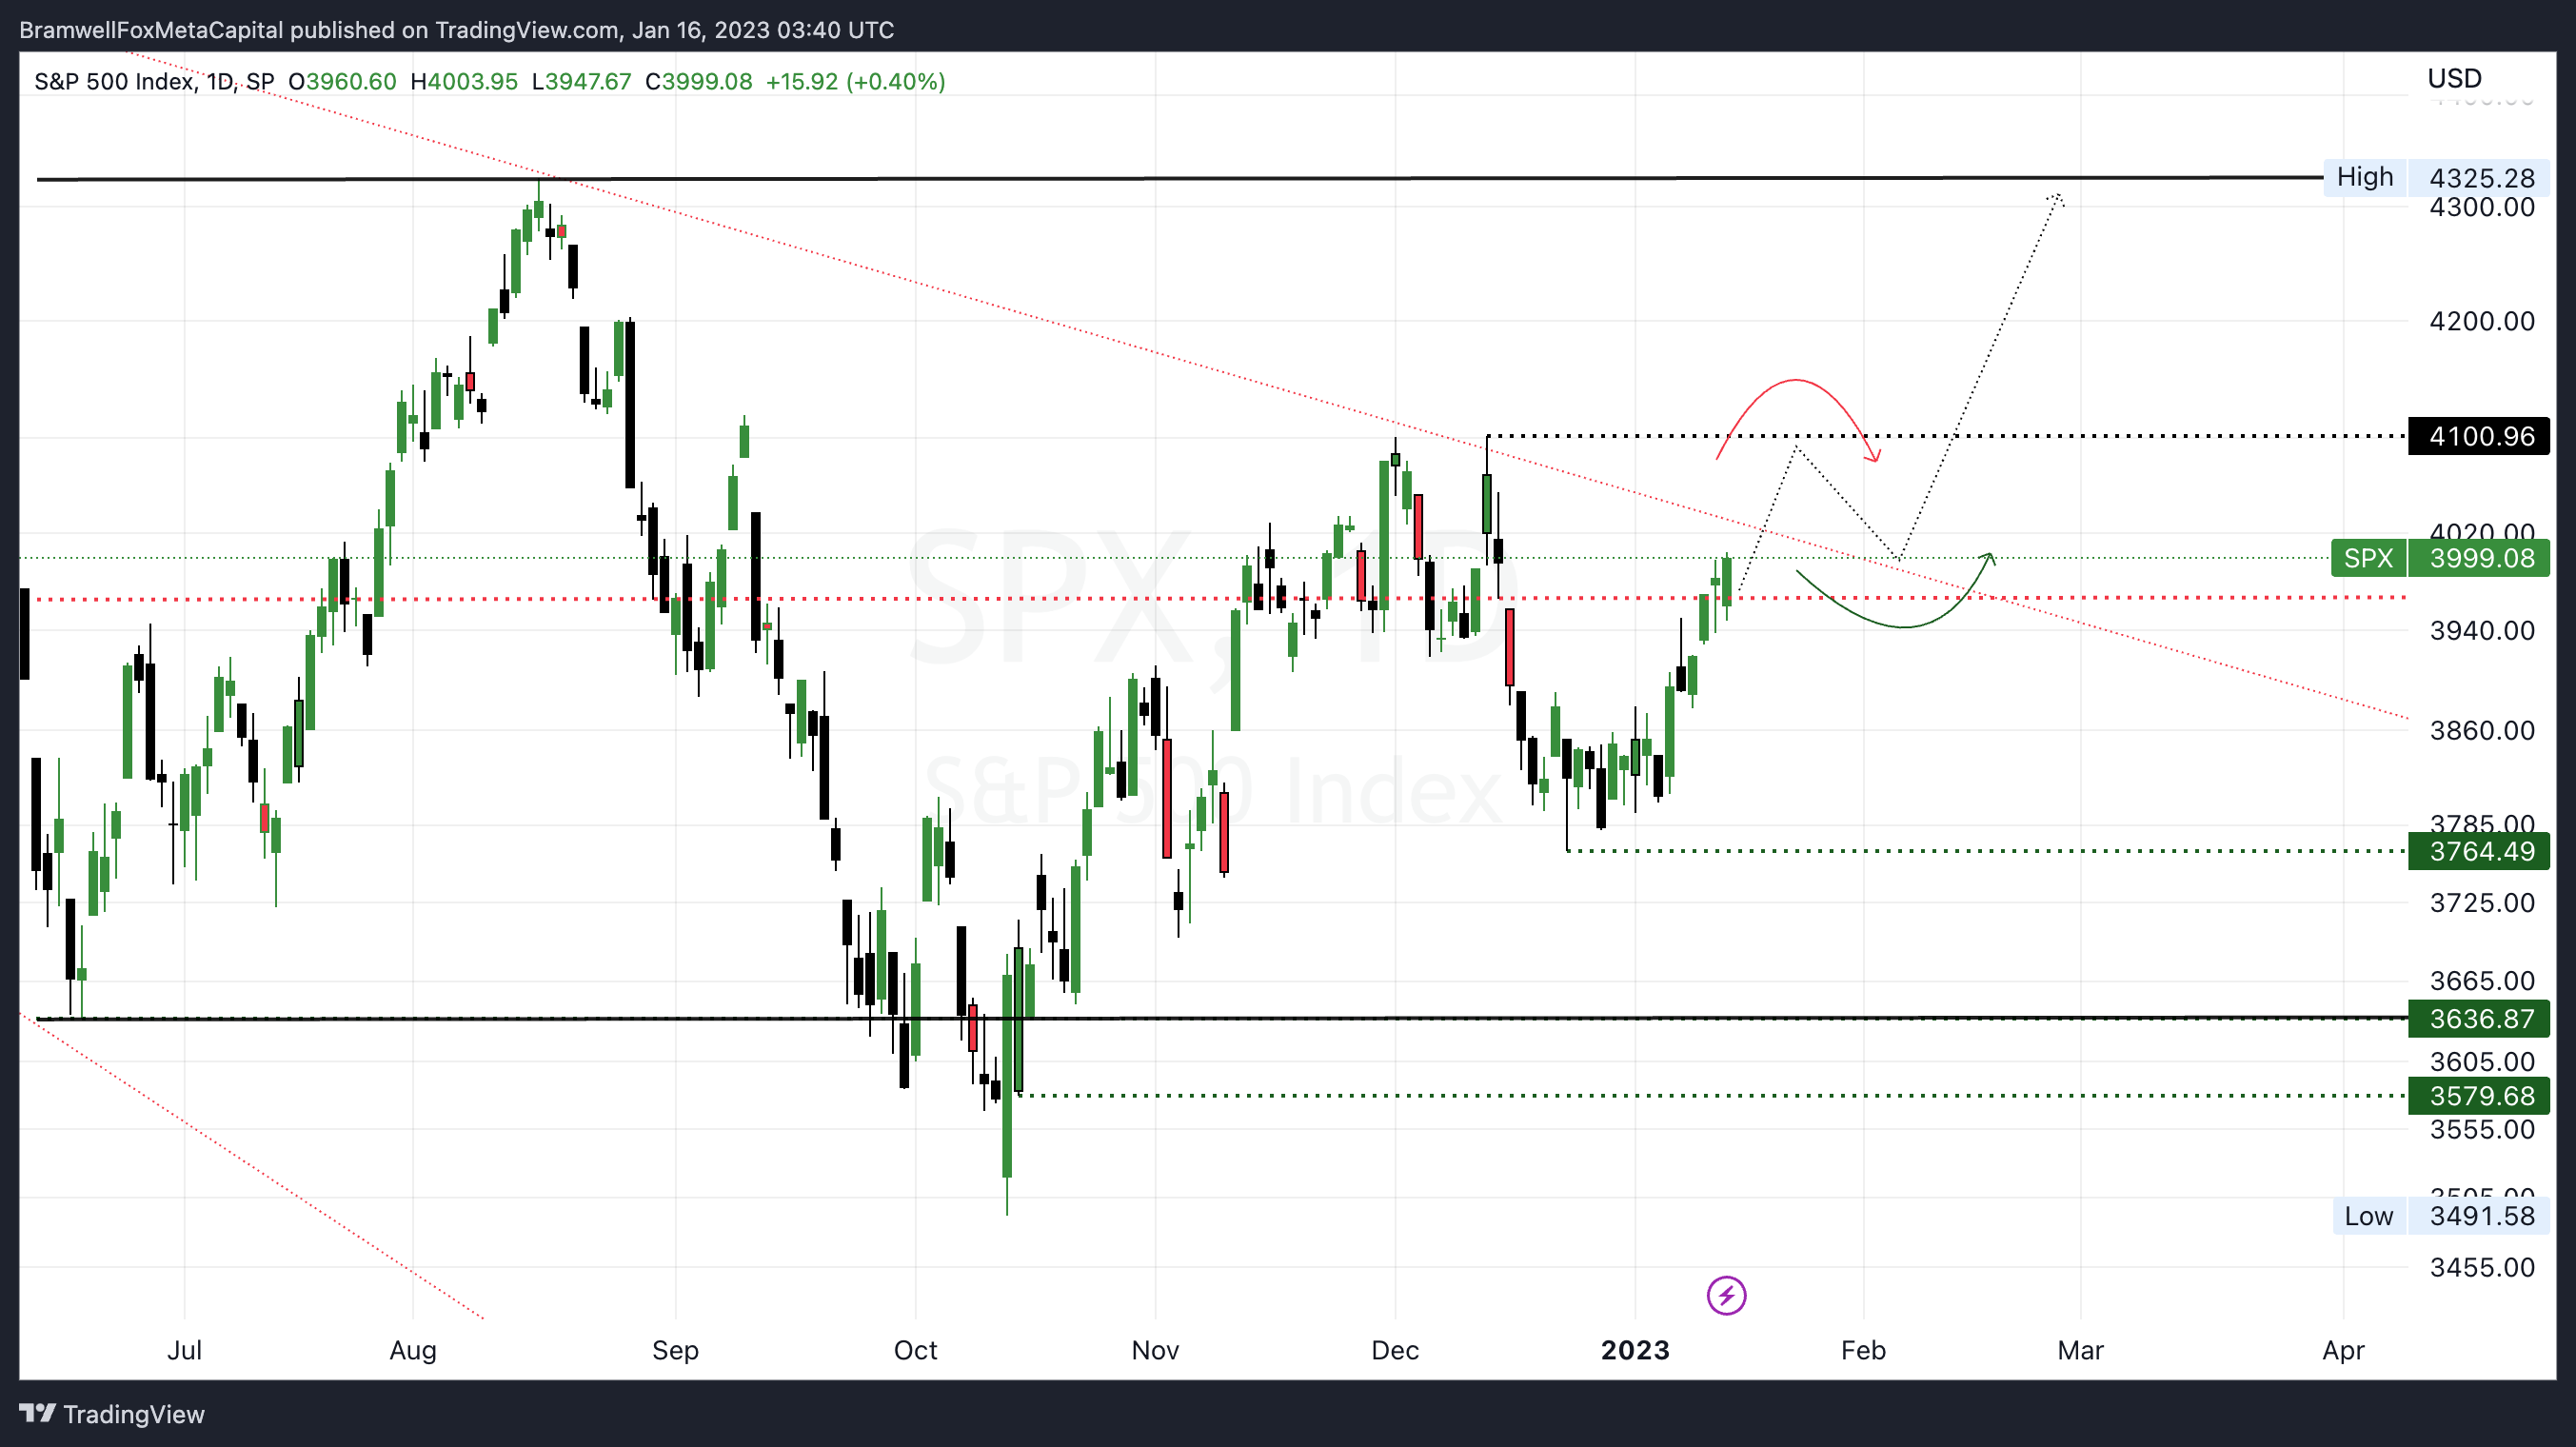
Should a harsh rejection occur at the resistance line or a swing failure pattern print on the week ahead, it may serve as a Mayday alert to exit risk-oriented positions as likely an aggressive move to the downside will follow.
Featured Chart S&P500 1D (click to enlarge photo)
It’s important to take a look top down at all equity indices when trying to aggregate a directional bias on the market as a whole.
Here we see the TSX on a 5-day showing strength and wanting to reclaim the trading range above 20,500 as support with its sights on potentially breaking into all-time high territory should 22.2-22.5K be tapped in 23’.
I’m bullish on Canadian stocks and my current target is 21,025 in the short term.
Featured Chart TSX 5D (click to enlarge photo)

Treasuries
📉 US2YR ( 🎯 Target 4%)
💬 Matthew’s Commentary, Analysis & Prediction for the Week Ahead:
It’s important to note that when the yield on 2-year Treasury bonds falls, it generally indicates that investors are expecting the Federal Reserve to lower interest rates in the near future.
but how soon?
Well, with the U.S CPI data printing under expectations in addition to the jobless claims rising, we have two major criteria that the Federal Reserve will use in their FOMC decision at the end of January.
In other words, possibly soon.
Remember that lower interest rates make it cheaper for businesses and consumers to borrow money, which can lead to increased spending and investment. This can in turn stimulate economic growth. Additionally, lower interest rates also make it more attractive for investors to put their money into riskier assets, such as stocks, which can lead to higher stock prices and increased confidence in the economy.
Additionally, when the yield on 2-year Treasury bonds falls faster than the yield on 10-year Treasury bonds, it is known as a "yield curve inversion." This is considered to be a strong indicator of an impending recession.
A yield curve inversion occurs when long-term interest rates (like those on 10-year Treasury bonds) fall below short-term interest rates (like those on 2-year Treasury bonds). Typically, long-term rates are higher than short-term rates because investors demand a higher return for tying up their money for a longer period of time. However, when short-term rates are higher than long-term rates, it suggests that investors are more worried about the near-term economic outlook than the long-term outlook.
A yield curve inversion is often seen as a sign that the economy is about to slow down or enter a recession. The Federal Reserve also tends to lower interest rates in anticipation of a recession, but in this case, it is the market that is pushing the rates down, not the central bank.
..yet.
Featured Chart US2YR 3D (click to enlarge photo)

Cryptocurrencies
📈 Bitcoin (🎯 Target $25K) + 📈 XRP (🎯 Target .50)
💬 Matthew’s Commentary, Analysis & Prediction for the Week Ahead:
Bitcoin is breaking all of the bear market rules this week after printing a historic rise.
It appears that Bitcoin may have been forming an accumulation zone ever since its break of support under 18.6K in November - but was ~15.5K the market bottom?
It’s possible.
On the weekly timeframe we can see a strong bullish candle topped out in the mid 21.5K region and as of the time of writing this episode has yet to experience any meaningful pullback.
The two possible paths ahead for this week are to:
Close the inefficiencies in the price action by retracing a re-testing the range bottoms ~low 18K, offering a buying opportunity for alt coins and Bitcoin for late buyers.
A further short squeeze to the upside targeting 25K and clearing out the horizontal range high before a meaningful pullback occurs to re-test the downward sloping resistance (red dotted line) originating at the previous all-time high.
Featured Chart BTC 1W (click to enlarge photo)

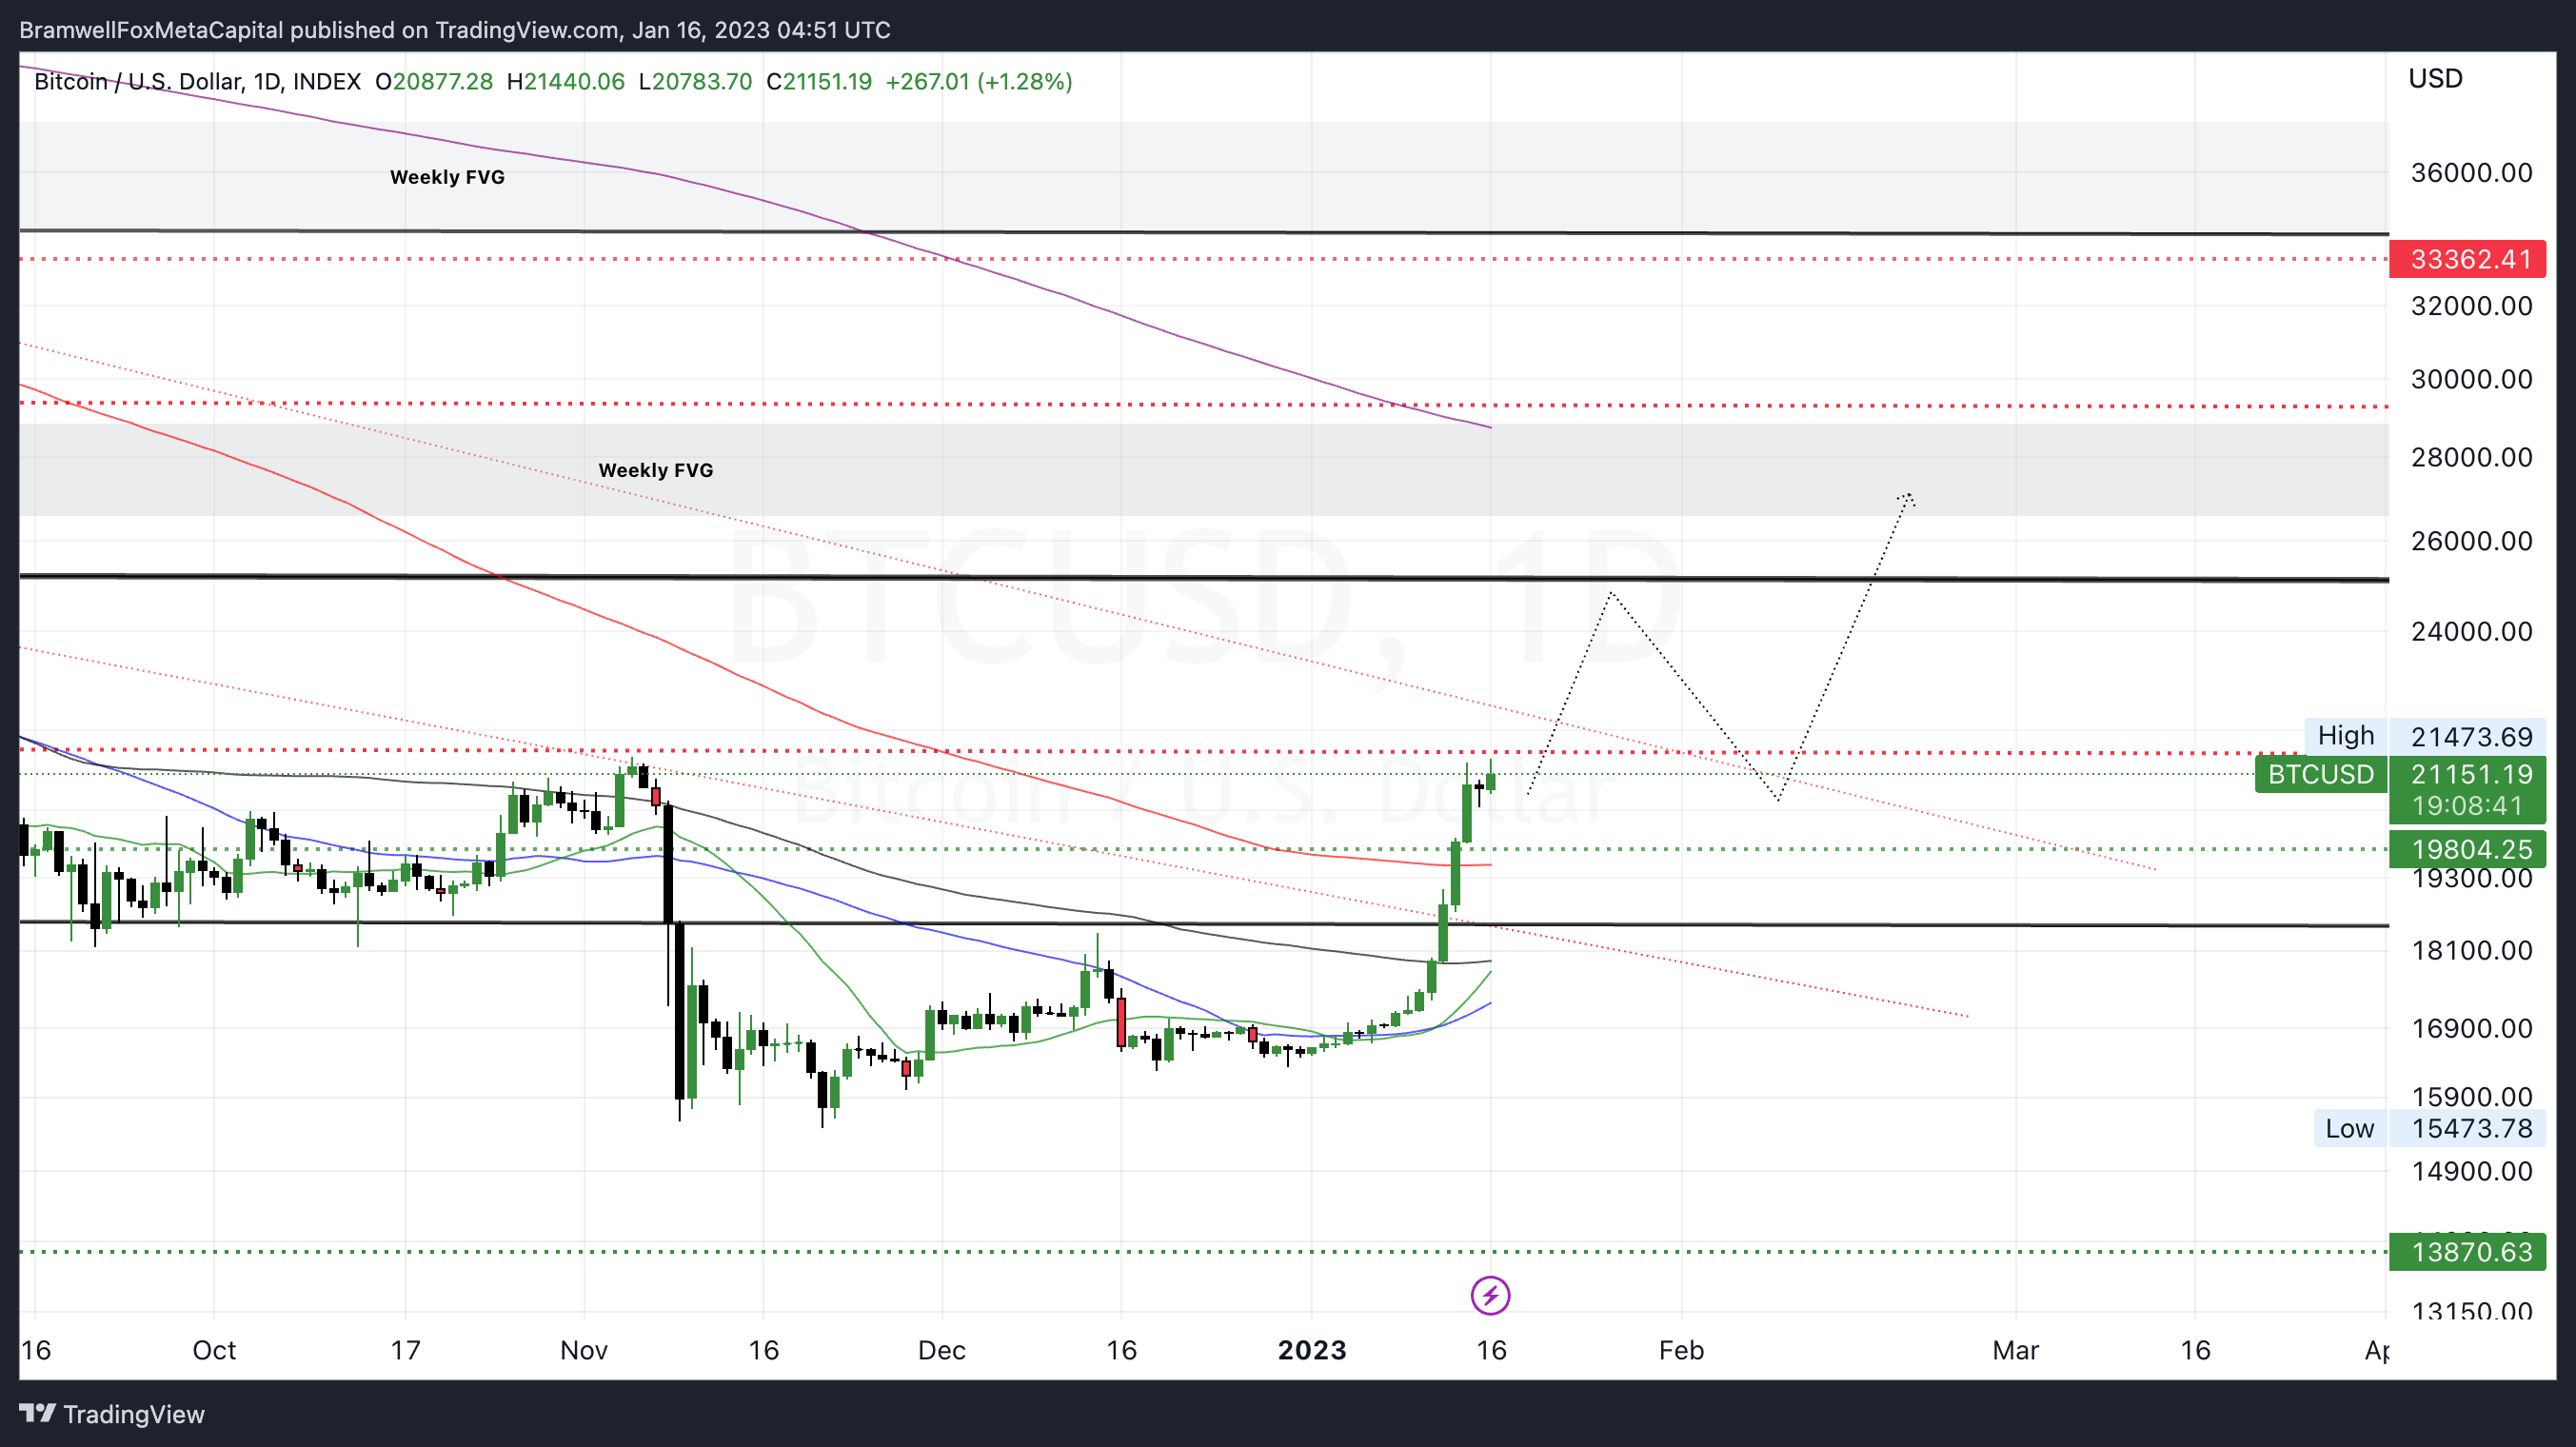
Zooming in we can see the 12+ days of green price action for Bitcoin.
It would be healthy to experience a reclaim of the 200 Day Moving Average (red) and or range low’s in the 18.1K region.
Featured Chart BTC 1D (click to enlarge photo)
XRP is set up to follow in Bitcoin’s footsteps with the exception being that a breakout of the low 40’s declining resistance would be far more significant for XRP’s price action.
We can see the bear market resistance on the Weekly timeframe is pressing against the current price action of XRP at .40 and a breakout would send XRP to the range high’s of .50 before gathering liquidity for a further push up into the weekly fair value gap around .65 cents.
Featured Chart XRP 1W (click to enlarge photo)

Should a rejection occur at this place in the charts for any reason, both fundamental or technical, it’s possible that an aggressive reversal occurs potentially sending XRP to new lows in the .25cent region.
However, my bias is bullish with the current state of economic affairs and as we zoom in these are two possible paths I’m expecting XRP to travel in the days and weeks ahead.
Featured Chart XRP 1D (click to enlarge photo)

Commodities
📉 Oil (🎯 Target $65) + Gold (🎯 Target $2K)
💬 Matthew’s Commentary, Analysis & Prediction for the Week Ahead:
Oil is pressing against resistance and looking for a breakout to the upside but in my perspective it’s not going to reach it, yet.
There are two separate headwind resistance lines ahead for Oil and I’m expecting for a failed breakout to result in an aggressive reversal back into the wedge channel with a bottom forming in the $65 per barrel region atop the 5D 200 moving average (red).
Now should a breakout occur, my first question will be “What is happening geopolitically” to cause such a demand spike or supply shortage.
It will be an important news week for Oil ahead, otherwise the technicals show weakness and short term further downside.
Featured Chart Oil 5D (click to enlarge photo)

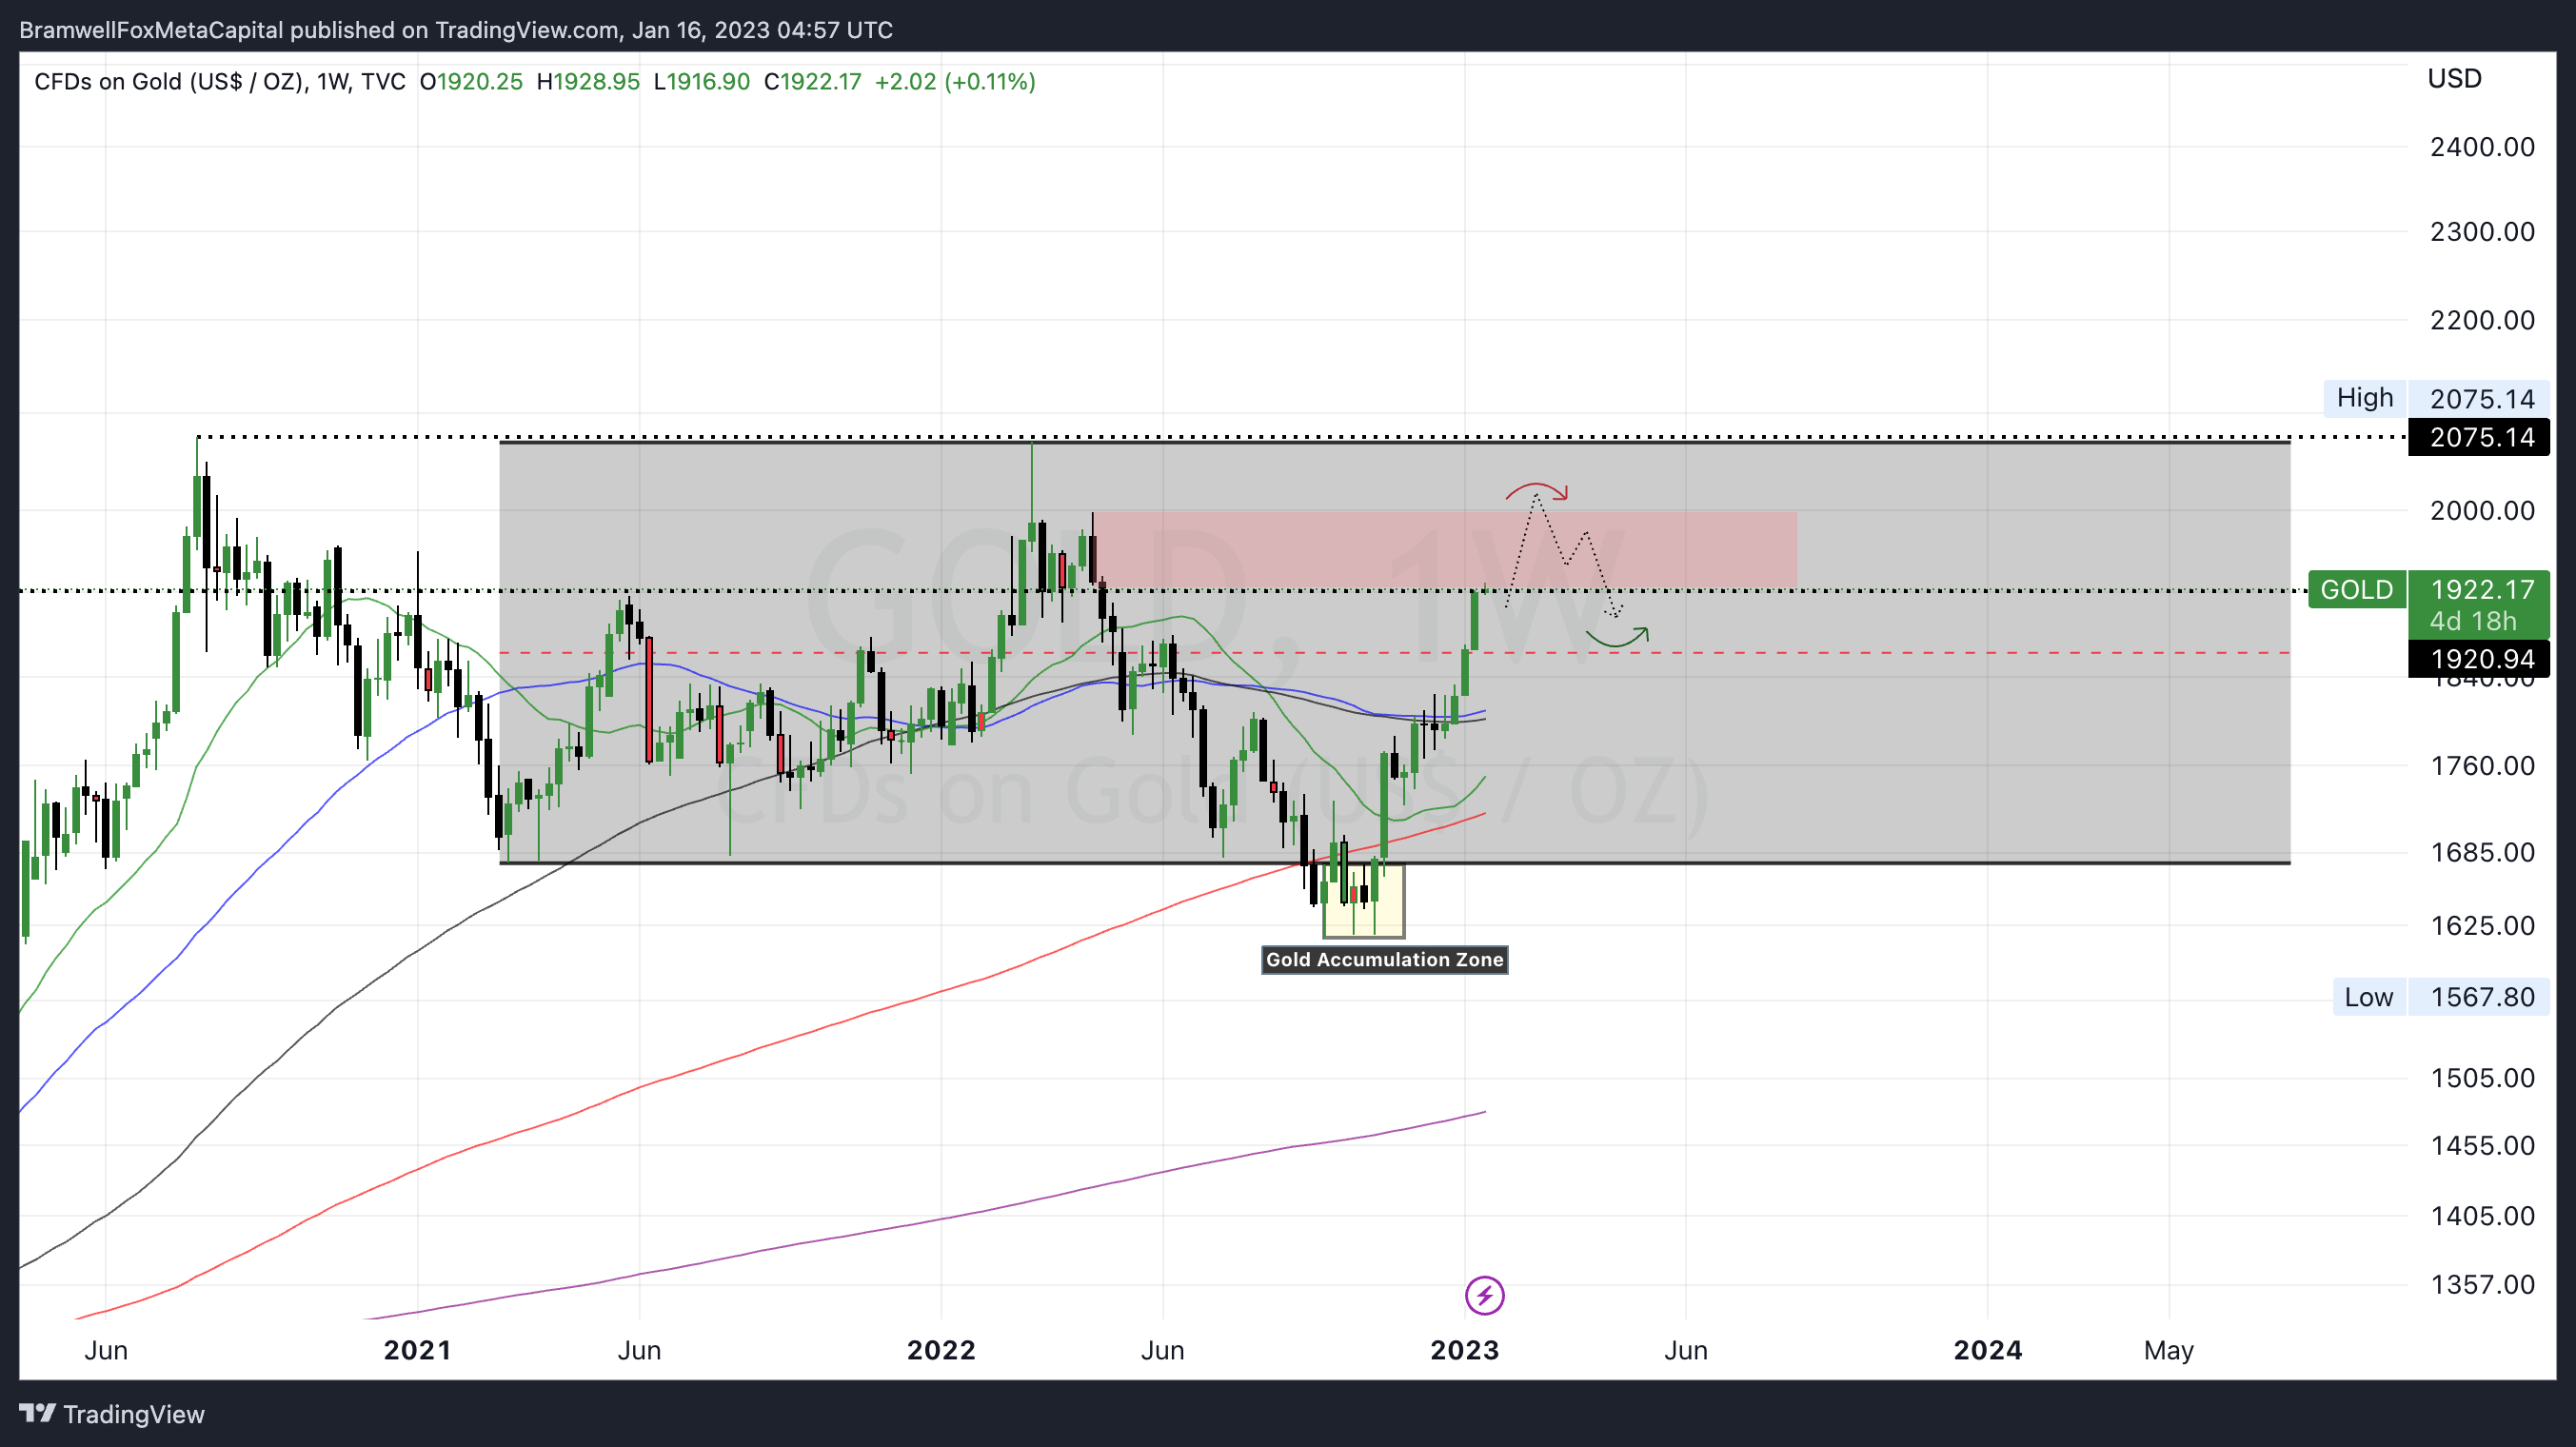
In July 2022, when Gold had broken below the range (highlighted in yellow as the accumulation zone) I projected that Gold would absolutely tear up the charts in 2023 as my bias projected weaknesses in fiat currencies due to a prolonged economic contraction - I was correct.
Now in 23’ we see Gold with enough strength to attempt a breach $2K per oz and experiencing price discovery into all-time highs.
In the short term I’ll be watching for news headlines surrounding the likelihood of a global recession and monetary policy decisions leading to a weakening USD as both scenarios are the bread and butter of Gold’s bull-run.
Featured Chart Gold 1D (click to enlarge photo)
👋🏼 Hey!
Thanks for reading this week's Weekly Market Update Edition No. 026
If you have any comments, feedback or questions on any material written in this edition please share as I'd love to continue a dialogue below.
If you enjoyed the read, I’d really appreciate if you’d share our community with your network of friends, family & fellow investors!