


🗞 Weekly Market Newsletter | Edition No. 42
News Update + A Full Analysis of Major Indices Including Stocks, Crypto, Commodities, Bonds & Forex

Sunday, May 28th, 2023
Hello Friends,
At the time of writing this newsletter, we've watched Bitcoin pump from the high 26K region (earlier this morning) to the mid 28K region, which is currently acting as a price resistance. You could say things are feeling a bit bullish heading into this week.
Chart 1: This Morning

Chart 2: Tonight…

What's the cause for the bullish momentum? Let's dive in.
Firstly, it's essential to understand that Bitcoin is the leader of the crypto space.
This is why $BTC is known as 'The King'.
The King always leads capital inflows (or the money vacuum) at the start of any bullish cycle.
Bitcoin's Market Cap Dominance represents approximately 48% of the entire crypto industry market capitalization, totalling approximately $545 billion.
This is probably why your grandma and Aunt Bertha have likely heard of Bitcoin in the news but not $PEPE Coin or the Songbird network.
This is also why, every so often, I'll add technical analysis for the chart BTC.D in my charts.
When BTC.D looks bearish yet a chart like TOTAL (Total Crypto Market Cap) is looking bullish, we can assume money is inflating the total crypto industry.
This is due to Bitcoin's percentage share of those inflows diminishing, which equals more money flowing into Altcoins and rotating out of Bitcoin.
There's a chart that also depicts this scenario: TOTAL2, otherwise known as Altcoin Market Cap, which I add below each week.
Let's circle back to what's driving the bullish momentum.
Speculation A: Short Squeezes
So, you know how people invest in crypto by buying a coin or token and hoping its price will rise, right?
That's called going long.
But there's another way to trade called shorting.
When you short, you're essentially betting the price will go down. You borrow a coin, sell it, then aim to buy it back at a lower price to return to the lender, keeping the difference as profit.
Now, the risky part of shorting is that if the price goes up instead of down, you're in a bind. You still have to return the borrowed coins, which means you must buy them at the higher price, resulting in a loss.
So, a short squeeze happens when the price of the coin unexpectedly rises sharply.
Those who shorted the coin will try to limit their losses by buying the coin as quickly as possible, which in turn can drive the price up even more. It's like a snowball effect: the more shorts that get "squeezed," the higher the price might surge.
This can happen even more dramatically in the crypto world compared to traditional markets due to the volatility of cryptocurrencies and the fact that crypto markets operate 24/7, allowing for continuous trading without the breaks seen in regular markets.
So my Speculation 'A' is built upon the premise that the market has been eerily quiet over the past week, pending the debt ceiling negotiations. Meanwhile, investors continue to monitor economic data pending the June FOMC meeting (more on this later).
This placed price areas of stagnant resting liquidity (or leveraged traders stop losses) on shorts attractive for price manipulation by large whales seeking to capitalize before the weekly open.
Speculation B: Investors Establishing Positions Pre-Debt Ceiling Negotiation Finalization
Over the weekend, it was announced that a handshake deal had been struck by both aisles of the U.S Government.
This deal would avoid a U.S Debt Default as early as this upcoming week.
Which in layman terms means Money Printer Go Brrr…
…or in nominal terms, continued fiat (U.S Dollar) devaluation in the short term (<2 years) to finance U.S Government operations.

It's very likely that the market will react with plenty of energy this week to the formal announcement of a successful agreement, but I wouldn't break out the champagne yet.
We do not know the final details of the pending bill nor how the ripple effects will triangulate across various markets.
One thing I can say for sure is that it's likely U.S Treasuries will experience capital inflow, thus decreasing the 2 & 10YR yields, which has been a pretty obvious call in my charts for weeks.
With bond prices rising and a potential deal struck, the chaos over the U.S. defaulting and the credit rating decrease fiasco dominating headlines last week will be put to rest. This would be a relief for risk assets in the stock market as well as crypto.

Thus, our attention pivots back to the status quo Super Bowl of finance, the Federal Reserve's FOMC meeting in June. Last week, we received an unpleasant surprise from the April PCE data, beating expectations by 0.5% (4.4% actual vs. 3.9% estimated).
This was bullish for Biden’s economic growth clout, but not so good for Chairman Powell, who incessantly repeats aloud that the Federal Reserve's job is to maintain price control and return inflation to 2%.
Thus market participants are expecting and pricing in another rate hike in June by perhaps a quarter point and possibly another in July of the same amount.
Therefore, it's not exactly time for popping champagne, yet.

Into the week ahead (shall we) as we continue monitoring data releases, especially Non-Farm Payrolls and the Unemployment Rate.
I say this with unfortunate sarcasm and dry humor: “Fingers crossed that people are losing jobs, and the economy is looking as bad as possible.”
Switching gears to a few important headlines from last week, Coinbase kicked off a beautiful 'Update The System’ campaign. They are full throttle pumping crypto adoption into the veins of Congress/Washington.
I suggest you watch this video below (click to watch as Elon has taken away Substack authors Twitter embedding privledges, smh 😒)

And not to get you too excited, but Nasdaq congratulating Ripple in Times Square for their $250M acquisition of MetaCo (even though Ripple is still pre-IPO and a private company) appears extremely bullish to me.
Especially given the fact that Nasdaq is set to launch crypto custody services in Q3 2023’.

So, put the puzzle together, everyone.
There is certainly a bullish energy in the air, but we remain cautiously optimistic that the worst is behind us. On that point, what would a bullish cycle look like for the remaining part of 2023?
I'd like to introduce a good friend of mine and an extremely experienced and accurate market analyst, @CredibleCrypto on Twitter. His argument is that Bitcoin is now completing the last impulsive wave upwards and will set a new all-time high in 2023/24, catching everyone off guard who has all but forgotten about crypto.

Remember, profits flow from Bitcoin into Altcoins, and this argument would give us reason to believe that Q3/Q4 2023 may be the bull run we have been anticipating for our first round of profit taking across our portfolios after a cold crypto winter froze our positions solid since 2021.
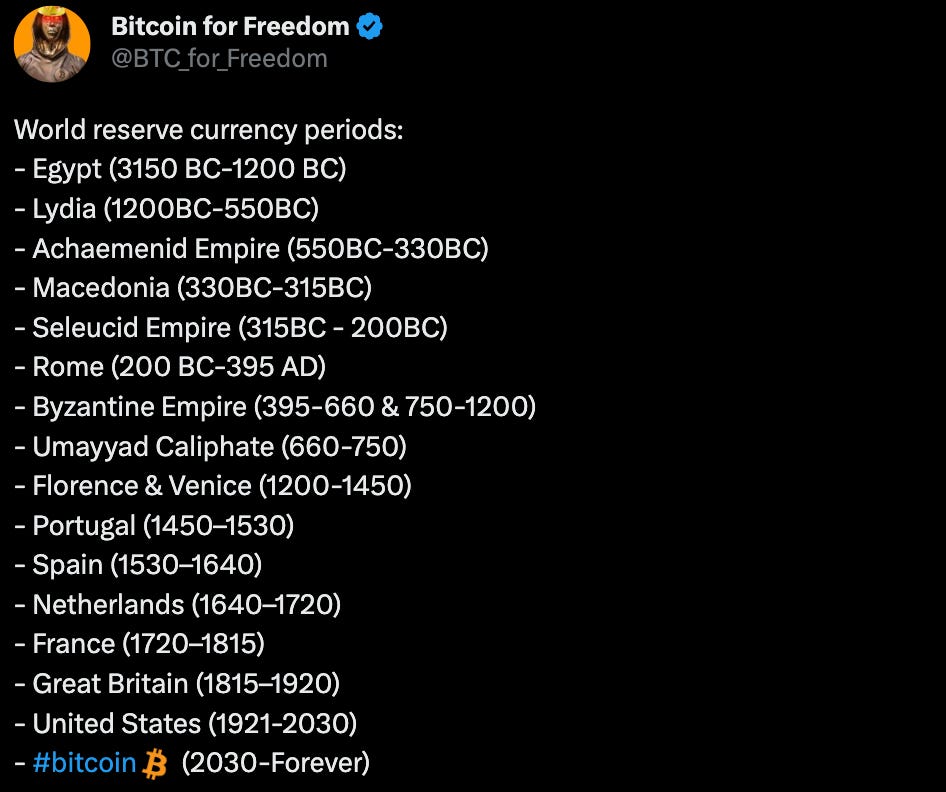
It’s worth mentioning that all of this is happening at the same time that the U.S Dollar appears to have run its course in history as the global reserve currency. As you can see below, it’s likely that fiat, as we know it, will soon be a relic of the past.
We are truly entering the dawn of the Exponential Age of Technology, which includes Blockchain, Quantum Computing, and Artificial Intelligence.

Don't take my word for it, simply glance at chip manufacturer NVIDIA’s historic stock price rise this past week as they added $150 billion to their market cap upon releasing quarterly earnings and discussing how they are on the precipice of changing computing and processing technology as we know it.
I appreciate each and everyone of you tuning in each week to my thoughts and analysis on the market, now bring your eyes below and expand each chart for my thoughts on where each index and asset is heading this week.
Until next week, may we keep our viibes high and our profits plentiful.
- Matthew Fox
Fox MetaCapital’s Weekly Asset Review + Technical Analysis
📈📉 The Week Ahead in Charts
Symbols 📈 or 🐂 = Bullish / Positive | 📉 or 🧸 = Bearish or Negative | ⚖️ Ranging or Low Volatility
💬 Matthew’s Commentary, Analysis & Prediction for the Week Ahead:
My bias this week is founded upon the DXY (U.S Dollar) rally topping out at ~104. If this is the case, we ought to see strength across the EUR and CAD respectively.
Triangulating the inverse correlation of the U.S Dollar to equities, I’m expecting the S&P500 to break upwards taking out the highs of 4325 yet I’m expecting the TSX to lag behind due to weakness in the Oil technicals which the Canadian markets rely heavily on for balance sheet beats.
With the U.S debt negotiations close to finalization, I’m expecting inflows into treasuries to drop yields sharply as bond prices rise. This deflationary signal may slow inflows into Silver & Gold, but I still have a bullish hat on for Gold into Q3/Q4 as we must realize that increasing the debt ceiling will mean inflationary pressures no matter how they word it formally.
A monumentally important ruling in the SEC vs. Ripple case is around the corner which may be the spark that Altcoins need to crate momentum in TOTAL2, and I’m expecting market participants to begin accumulating positions in preparation for June FOMC which may be the catalyst for Bitcoins rally into 32K-35K.
Take a look at the charts below for further analysis.
FOREX
📉 DXY(U.S Dollar) + ⚖️ CAD + ⚖️ EUR
Featured Chart DXY 1D (click to enlarge photo)

Featured Chart CAD 1D (click to enlarge photo)

Featured Chart EUR 1D (click to enlarge photo)

Equities
🐂 S&P500 + ⚖️ TSX + ⚖️ VIX
Featured Chart S&P500 1D (click to enlarge photo)

Featured Chart TSX 1D (click to enlarge photo)

Featured Chart VIX 1D (click to enlarge photo)

Treasuries
📉 US2YR & 📉 US10YR
Featured Chart US2YR 1D (click to enlarge photo)

Featured Chart US10YR 1D (click to enlarge photo)

Cryptocurrencies
📈 Bitcoin + 📈 XRP + 📈 Total Crypto Market Cap + 📈 Total Altcoin Market Cap
Featured Chart BTC 1D (click to enlarge photo)
Featured Chart XRP 1D (click to enlarge photo)

Featured Chart TOTAL 1D (click to enlarge photo)

Featured Chart TOTAL2 1D (click to enlarge photo)

Commodities
📉 Oil + 🐂 Gold & ⚖️ Silver
Featured Chart Oil 1D (click to enlarge photo)

Featured Chart Gold 1D (click to enlarge photo)

Featured Chart Silver 1D (click to enlarge photo)

👋🏼 Hey!
Thanks for reading this week's Weekly Market Update Edition No. 042
If you have any comments, feedback or questions on any material written in this edition please share as I'd love to continue a dialogue below.
If you enjoyed the read, I’d really appreciate if you’d share our community with your network of friends, family & fellow investors!