


🗞 Weekly Market Newsletter | Edition No. 34
News Update + A Full Analysis of Major Indices Including Stocks, Crypto, Commodities, Bonds & Forex

A note to the reader;
For this week’s edition I’m going to structure the newsletter with a variation from my typical outline and write this as a personal blog / journal style vs. the section by section breakdown of headlines news followed by technical analysis.
-
Sunday, March 12th, 2023
Hello Friends,
In the nearly 3+ years I’ve been actively day trading crypto, aggregating macroeconomic narratives and writing about the world of finance, this past week must rank #1 amongst the most suspenseful and action packed weeks of them all.
With the March FOMC meeting on the horizon, institutional and retail market participants all over the world are hustling to secure their capital positions, speculating on how interest rates will impact the appetite for various investment classes, including equity indexes, commodities, money market funds, and of course, crypto.
Part One | Q1 23’ has been 🔥, but not necessarily in a good way.
Let's take a moment to recap what's happened in the first quarter of the year so far.
The year 2023 kicked off on a bullish note for risk assets, with Bitcoin leading the charge by soaring nearly 60% from the lows of its bear market. Meanwhile, the S&P500 showed incredible strength by breaking out of its bear market trend and even touching off at 4200 in early February.
However, this bullish trend was halted by an outrageously strong labor market report released at the end of January.
Unemployment fell to 3.4%, and the US added 517,000 jobs, almost 250% more than what analysts had estimated.
This caused market investors to question if the Fed would need to continue raising rates higher for longer, making risk assets less attractive due to the high interest yield from parking money with the Fed, rather than taking a gamble on the volatility of stocks.
As a result, there was a sell-off of US treasuries, as locking your money away for 2-10 years for sub 5% was not nearly as attractive as parking funds with the Fed for a possible terminal 5% rate.
With this news, a US Dollar rally was sparked.
As February rolled around, the market listened intently to every economic data release, hoping for signs of a contracting economy and cooling inflation. The speculation was that the Fed would have sufficient reason to keep the priced-in 25 bps hike a shoe-in in March.
Unfortunately, the February CPI printed hot, as did many S&P500 corporate earnings, indicating that the economy still hasn't reached a period of sufficient contraction to warrant a Fed pause on rates.
Slowly but surely, the market began to price in the possibility of the Fed hawkishly announcing a 50 bps hike in March, starting with a 10% probability, then increasing to 25%, and eventually reaching 50% in the lead-up to this past week, where the probability hit 60%.
As the U.S debt ceiling was breached, reaching nearly $31T and economists projected that annual interest payments alone on this debt would exceed $1T, faith in the U.S economy began to downslide.
Consequently, U.S Treasury Bond yields began to climb, indicating investor uncertainty and doubts about the country's financial future.
And remember, as yields increase, bond prices drop, which leads to an increase in consumer financing costs such as mortgage rates for homeowners.
If you think it couldn’t be worse, think again. On top of all of this consumer credit card debt reached an all-time high of $930B, while at the same time, consumer savings rates have absolutely collapsed.
This combination of rising costs of goods and services, along with increased consumer debt and reduced savings rates, puts many individuals and families in a precarious financial position, to say the least.
Thus heading into this week, this was the general sentiment of the market.

And then this week something broke.
(more on this in a moment, keep reading)
Part Two | Crypto, Hero or Villain?
Just a week ago the BIS declared that they had ‘won’ the war vs. Crypto.
But have they?
While these types of statements and actions by regulatory agencies, including the SEC, may be aimed at swaying public opinion towards international regulation of the crypto market, they may also be an attempt to hold off adoption of a new international monetary system until the very last moment.
It's critical to acknowledge that the USD holds the position of being the global reserve currency, and any loss of this status would have severe implications for the United States' power on the global stage.
This is why the regulatory agencies' attempts to assert dominance through regulation may be part of a larger political agenda aimed at maintaining the United States' position in the global financial system.
In February, we saw the SEC force a settlement with leading crypto exchange Kraken over possible securities violations.
This was a move to gain ground on establishing small legal victories that over time would grant legal precedent in the courts over how crypto entities and blockchain projects must attempt to comply with existing laws.
Despite the fact that crypto is an evolving technology that requires a new discussion on how to regulate its profound nature, regulatory agencies continue to attempt to fit it within the framework of existing laws.
It’s completely backwards and defensive thinking for a nation that has embodied the technological race since they first landed on the moon - it simply makes me ask one question, why?
In fact, just this week the Attorney General of New York launched a new lawsuit against exchange KuCoin for similar securities violations. However, this lawsuit adds a new threat by claiming that blockchain Ethereum may also be considered a security.
This elevated attack now places nearly the entire altcoin market at regulatory risk of persecution.

It’s an all out offensive attack by the global governments to choke point crypto innovation and limit the spread of this technology until they can ultimately control it and tax it.
And if they can’t get a ruling fast enough in the courts, they’ll place sufficient pressure on the banks that service crypto firms in an attempt to de-finance them from their day to day operations.
Part Three | The first Jenga Block to fall, the banks.
As you may have heard in the news, this week the U.S experienced the second largest bank failure in history with the collapse of Silicon Valley Bank, this coming just days after the failure of crypto-friendly Silvergate was forced to shut down and liquidate.
The events began with Silvergate's announcement on Wednesday to voluntarily wind down operations and liquidate the bank, followed by Silicon Valley Bank's stock crashing 60% on Thursday due to liquidity issues.

On Friday, it was officially announced that SVB had failed and was taken over by the FDIC.
The bank failed due to the majority of the assets it held, treasury securities or bonds, purchased in 2021, which resulted in major losses after bond yields soared.
While they attempted to raise capital by selling stocks and bonds, but it was not enough and a bank run ensued. Panic among customers led to a major snowball effect resulting in FDIC intervention and the U.S Treasury and Federal Reserve having to take emergency measures that were announced just a few hours ago.

While many are not assuming this to be a 2008 similar collapse to Lehman Brothers or Bear Sterns, it is the second-largest bank collapse in the history of the United States and the largest since '08.
Investors will now focus on identifying banks with large interest rate risk and too much leverage which is the slow unravelling of trust in the legacy (and centralized) fiat based banking system.
And do you remember why Bitcoin was created in 2008, as a solution to this very anticipated problem.
CEO of Ripple, Brad Garlinghouse shared his perspectives this morning on the unfolding situation taking a jab at the fragility of the world economy as we speak.

We are on the precipice of possible utter chaos in the global economy, and every single move that both the Federal Reserve and U.S Government make in the coming weeks will have cascading effects on:
Tradfi liquidity and solvency risks: The recent bank failures and liquidity issues demonstrate that even well-established financial institutions are not immune to liquidity risks. If more banks begin to experience similar issues, it could have a domino effect on the broader financial system.
Capital markets volatility: Uncertainty surrounding the economy and the direction of the Fed may lead to increased volatility in capital markets.
Citizen trust in the fiat system: As traditional financial institutions experience difficulties, citizens may begin to lose trust in the fiat system altogether. This could lead to increased demand for alternative forms of currency, such as cryptocurrencies, and potentially threaten the hegemony of the U.S dollar as the global reserve currency.
Current consumer deposit protection laws: The recent bank failures highlight the need for stronger consumer deposit protection laws. If depositors lose confidence in the ability of the FDIC to protect their funds, it could lead to a run on banks and further exacerbate liquidity issues.
Inflation: If the Fed continues to raise rates to cool the economy, it could lead to continued interest rate risk from other institutions improperly hedged. On the other hand, if the Fed pauses or lowers rates, it may lead to further inflation and continued soaring costs. A bittersweet catch 22.
Technological innovation regulation: As technological innovation continues to disrupt traditional industries, regulatory agencies are struggling to keep up. If regulatory uncertainty persists, it could stifle innovation and lead to unintended consequences for both businesses and consumers.
Part Four | Moving into this week…
As we approach the March FOMC, the upcoming week will be crucial in determining the extent of the fallout from the recent events that occurred since Friday.
It remains to be seen if any other institutions have exposure to the liquidity contagion.If the US Treasury and Federal Reserve intervene to protect depositor funds, it could send a message to the banking sector.
Additionally, the collapse of the three most crypto-friendly banks in the US raises concerns about the impact on the crypto sector.
We must keep our eyes glued to the headlines on Tuesday as the path chosen by the Fed on March 22nd will be largely dictated by the upcoming CPI report to be released this week - should it print hot I can’t imagine the stress that will be placed on the U.S central bank to make the right call.

In the short term, my opinion is that the Federal Reserve will maintain rate hikes at 25 bps, which could lead to a continued rally in risk assets during Q1 and Q2.
However, it's important to note that there are pending litigations against Ripple and KuCoin on the crypto side, which could have far-reaching effects on the crypto sector.
There is also the possibility of absolute worst-case scenarios becoming an unfortunate reality for us digital asset investors, such as all crypto assets being deemed securities and prices falling 99% from here, or crypto-friendly banking institutions being wiped out for reasons decided by regulatory agencies against the will of the industry.
The future of the crypto sector remains at its most peak uncertainty at this very moment, and any developments should be closely monitored as well as any uncomfortable exposure being de-risked. I can’t stress this enough.
I’ll be back in your inboxes next week to report on how everything unfolded and preparing everyone for the important week of the 22nd.
Stay liquid,
- Matthew
Fox MetaCapital’s Weekly Asset Review + Technical Analysis
📈📉 The Week Ahead in Charts
Symbols 📈 or 🐂 = Bullish / Positive | 📉 or 🧸 = Bearish or Negative | ⚖️ Ranging or Low Volatility
FOREX
📉 DXY(U.S Dollar) + ⚖️ CAD
💬 Matthew’s Commentary, Analysis & Prediction for the Week Ahead:
From a technical analysis standpoint, the U.S Dollar has fallen back into the range of 101.5 to 105.25 with the median of the range the likely next stop for the DXY at 103.25, after having cleared the fair value gap that was being monitored for weeks.
The movement observed last week has formed a swing failure pattern, which usually leads to an aggressive move in the opposite direction of the rally.
Considering the pressures on the Fed to keep rate hikes at 25bps, the probability of a 50bps hike fades considerably. It is crucial to monitor the movements of the 2 & 10 year treasuries, as yields are expected to collapse, while the DXY is likely to find short term intra week support along the median and hold steady mid-range until the FOMC meeting on the 22nd.
From there, it is anticipated that the DXY will continue its bear market trend for weeks until clearing the FVG marked in grey slightly below the range support ~99.5.
Featured Chart DXY 1D (click to enlarge photo)

I anticipate that the CAD will likely strengthen against the USD in the coming weeks/months, but this will depend on several factors:
Commodity prices: Canada is a major exporter of commodities like oil, gas, and lumber. As commodity prices rise, demand for Canadian exports also increases, which can drive up the value of the CAD. Conversely, falling commodity prices could negatively impact Canadian exports and lower demand for the CAD.
Monetary policy: The Bank of Canada has paused rate hikes due to disinflation, which may not bode well for the CAD's demand. Investors may rotate capital into higher yielding economies, leading to a potential flattening of demand for the CAD.
Relative strength of the USD: A weakening USD can result in a strengthening of the CAD against the USD and vice versa.
In my opinion, the first two factors may not be as favorable for the CAD, and any gains against the USD will be primarily due to relative strength.
I was previously more bullish on the CAD ending 2022 and early Q1 2023, but shifting macroeconomic factors lead me to believe that the CAD may range between .7050 and .75 for the next few months.
Featured Chart CAD 1D (click to enlarge photo)

Equities
⚖️ S&P500 + 📉 TSX + 📈 VIX
💬 Matthew’s Commentary, Analysis & Prediction for the Week Ahead:
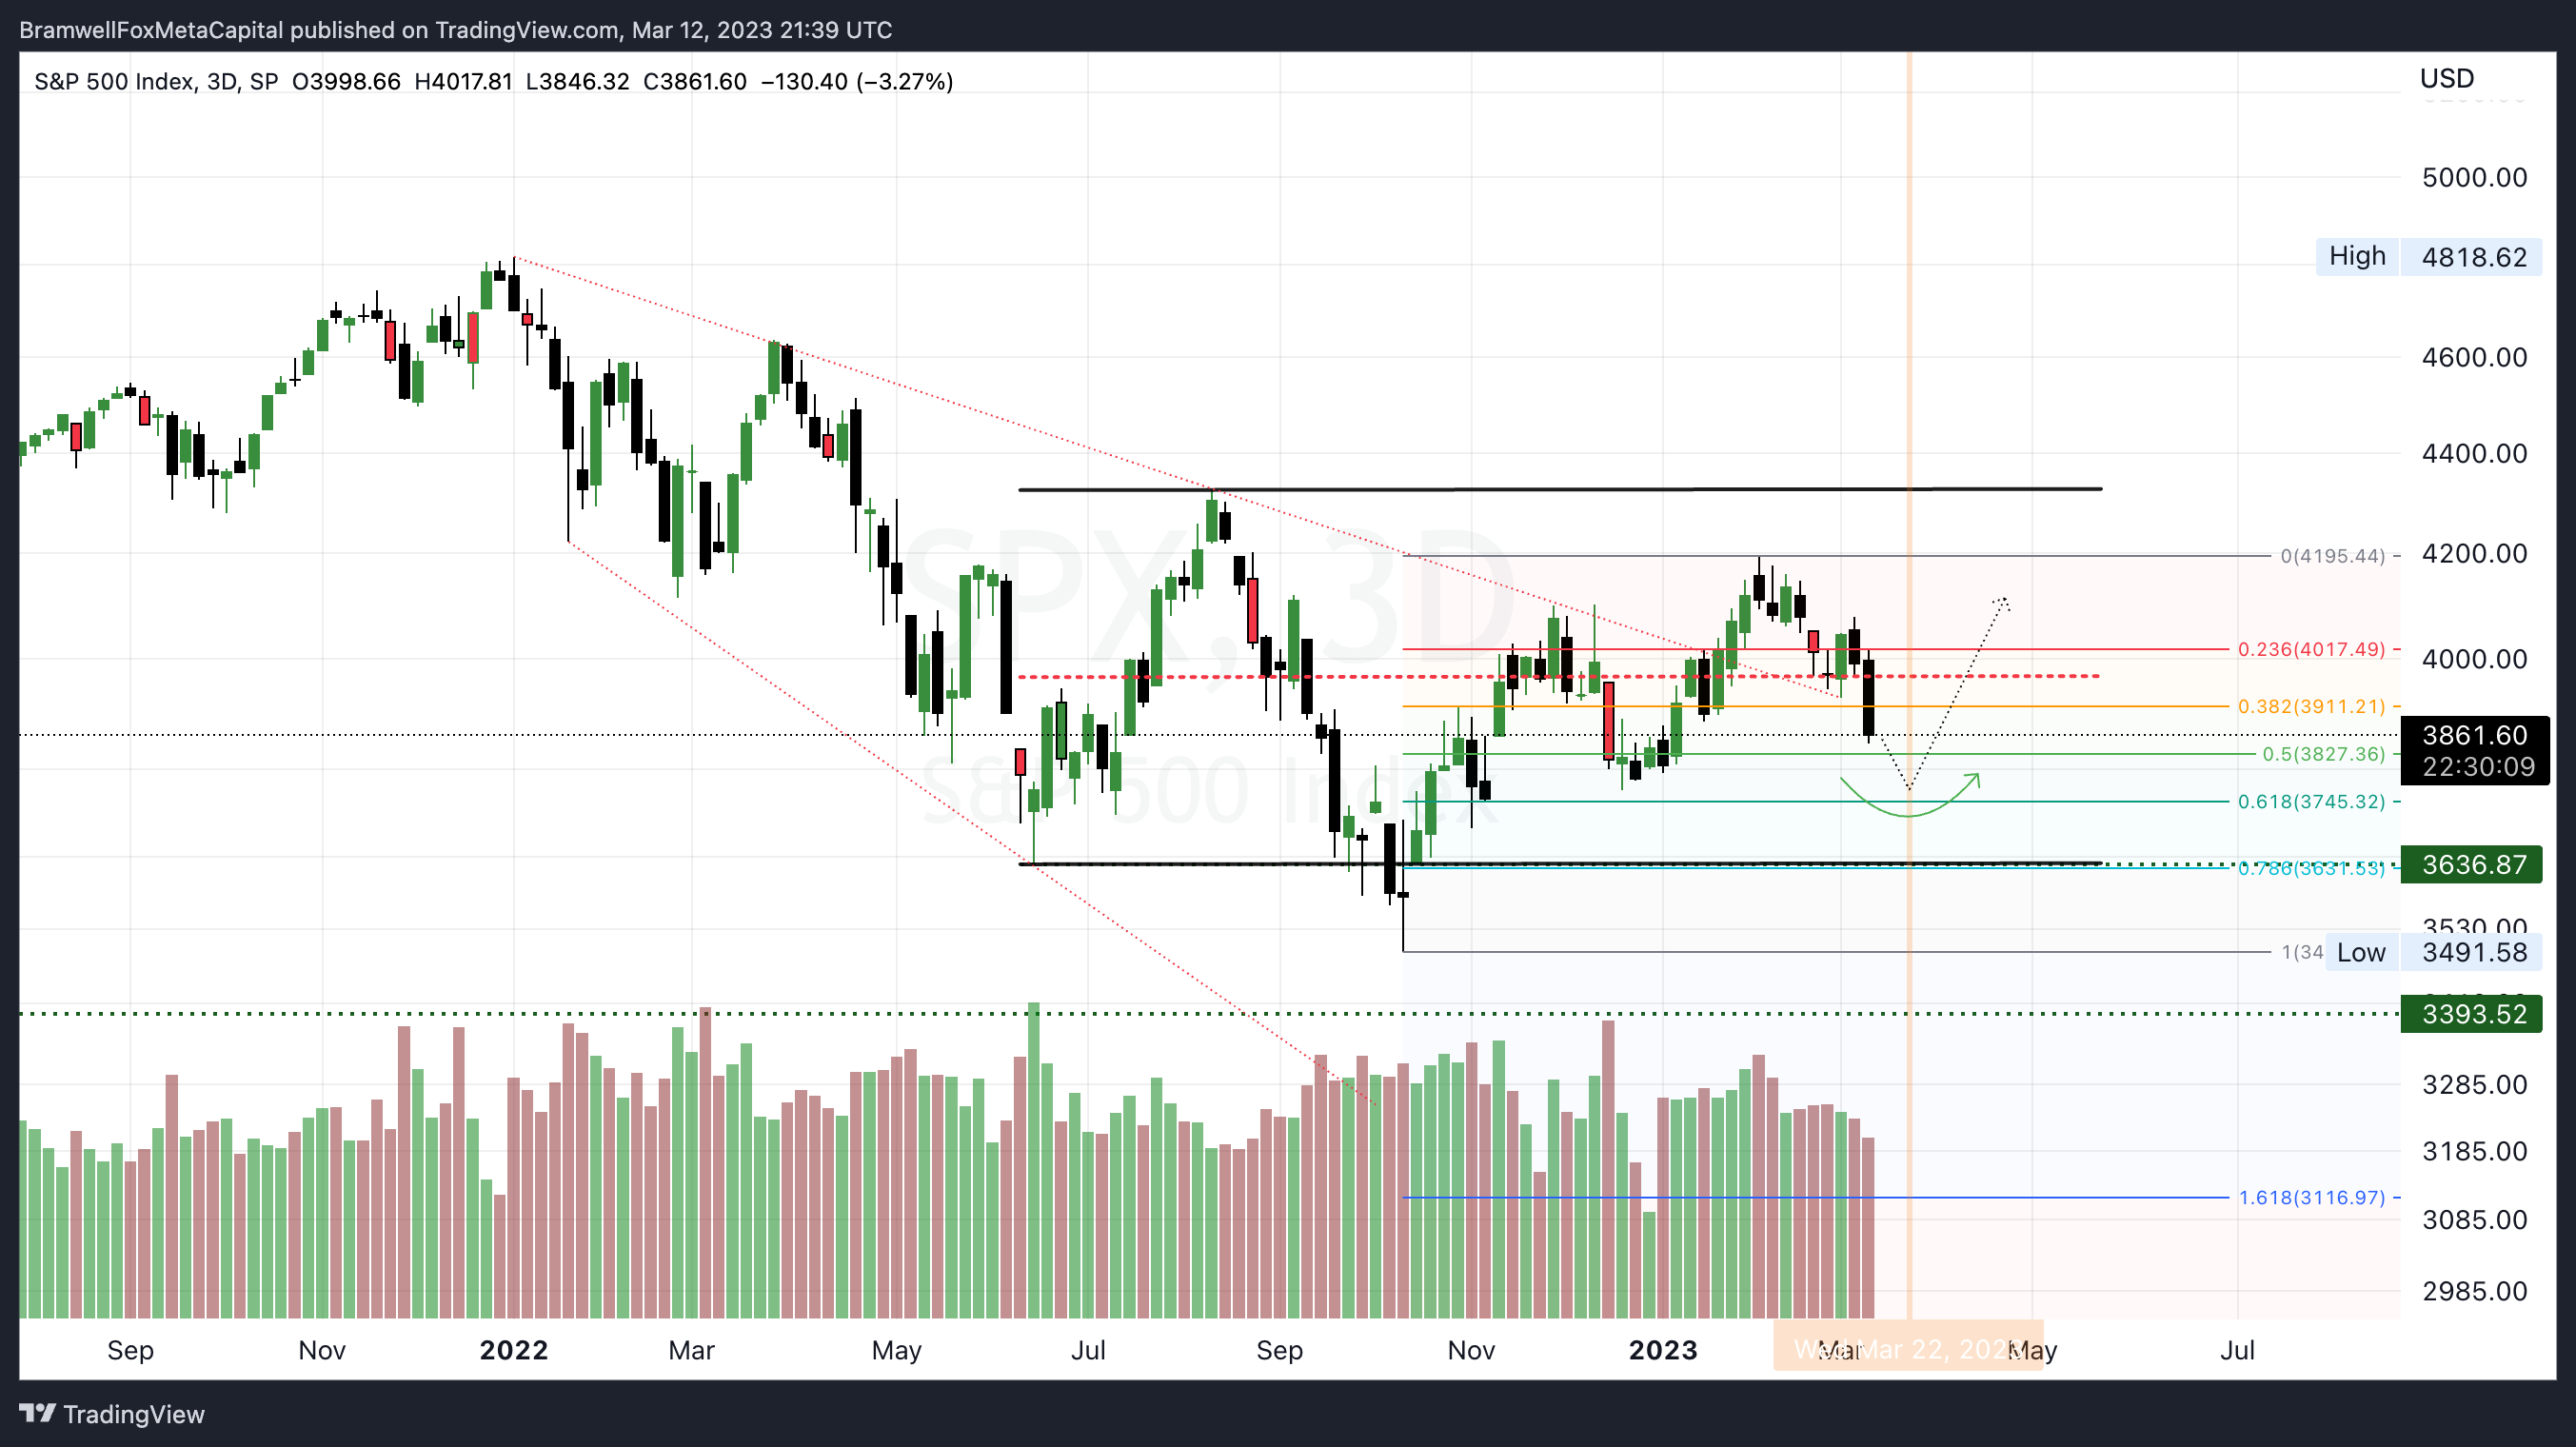
From a technical analysis standpoint, the S&P500 is currently retesting its diagonal bear market resistance from the recent breakout. Additionally, it's very close to its .618 Fibonacci retracement, which coincides with a support test of its weekly 200MA.
💡Remember that the Fibonacci retracement is a popular technical analysis tool that identifies potential levels of support or resistance during a trend meanwhile the weekly 200MA is a moving average that calculates the average price of a stock over a 200-week period, used to gauge the overall direction of the market trend.
As of writing, the S&P futures have shown strength leading into the week, but it's uncertain whether this strength will continue until further events unfold, especially those related to the banking sector after last week's events, in addition to the CPI reading on Tuesday.
It's likely that there will be continued sell-offs into the 3750 region before the uptrend resumes to test the range highs of 4325. For those unfamiliar with technical terms, the S&P500 is a stock market index that measures the performance of 500 large-cap companies listed on the US stock exchanges.
It's essential to watch out for Q1 earnings reports and any further deteriorating labor conditions as March comes to a close, as these events may have a significant impact on the stock market's overall performance.
Featured Chart S&P500 3D (click to enlarge photo)
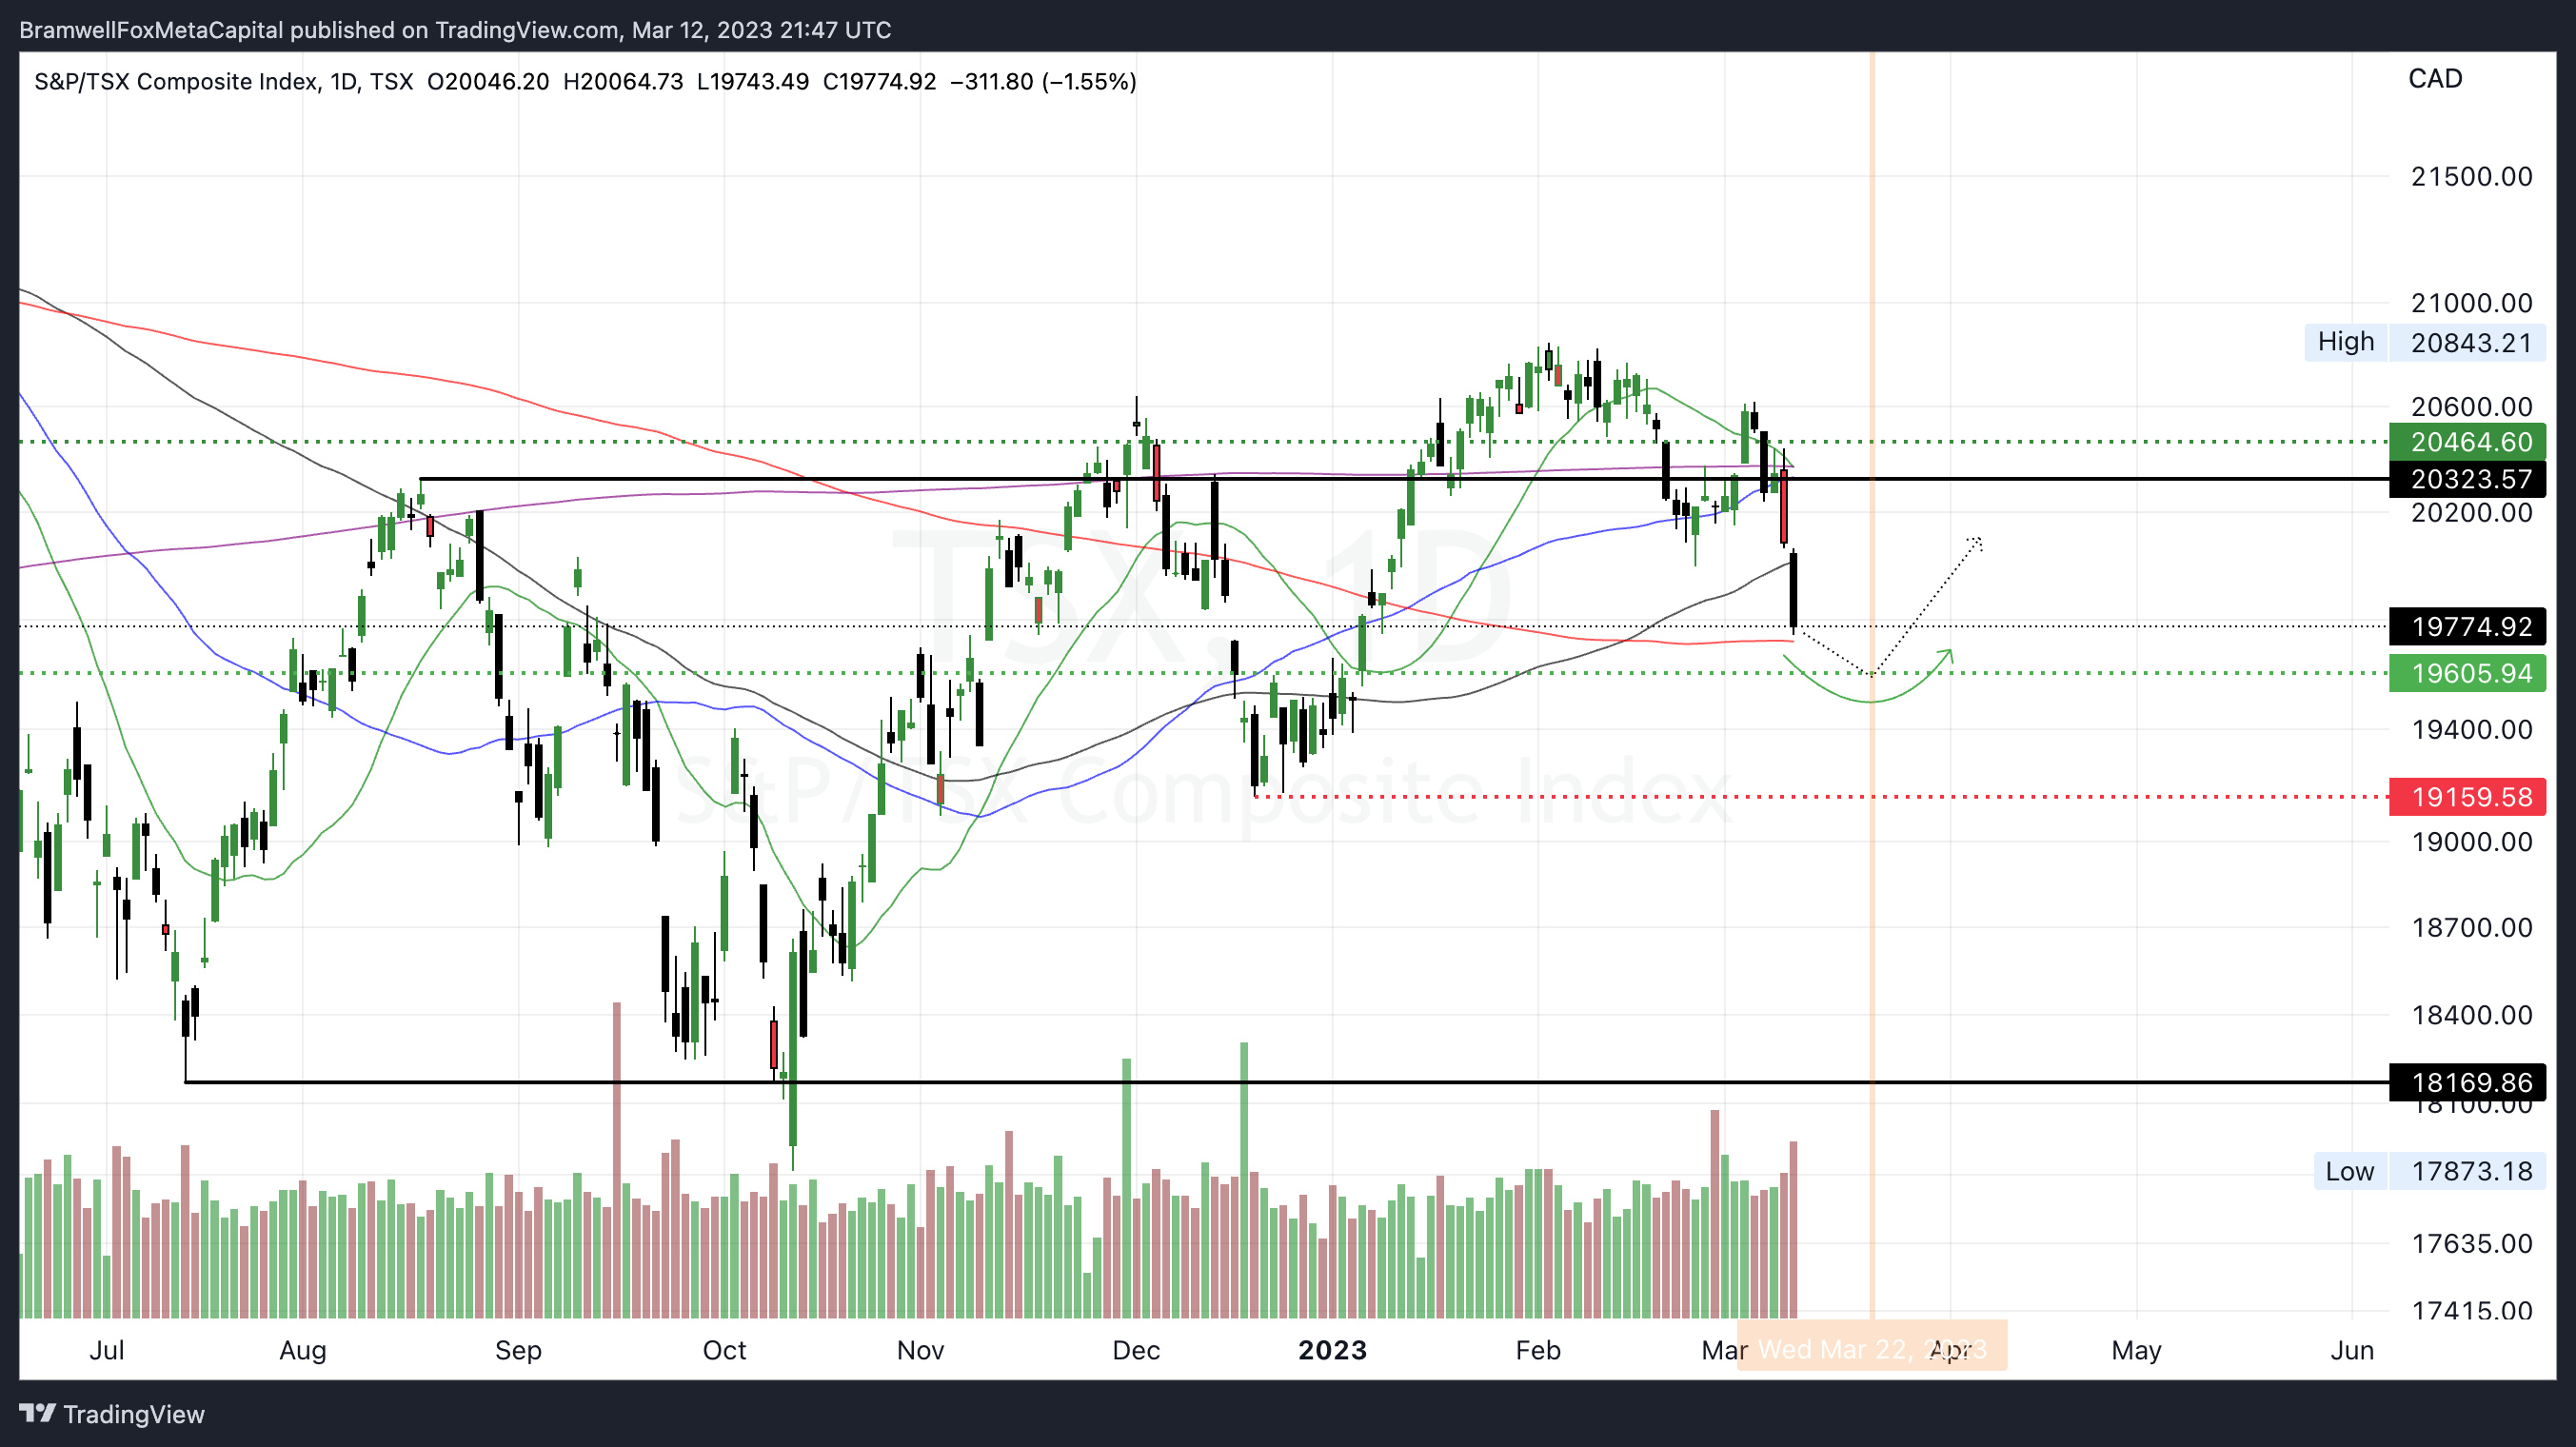
The Toronto Stock Exchange (TSX) attempted to break out of its range in January but was unsuccessful and fell back into its range. It may potentially test the 200-day moving average in advance of U.S monetary policy decisions in 10 days.
I anticipate the TSX to find support just above the July 2021 range lows of 19,605, but further movements will depend on economic developments in the energy and banking sectors in addition to overall market participants' sentiment for the Canadian economy as 2023’ unfolds.
Featured Chart TSX 1D (click to enlarge photo)
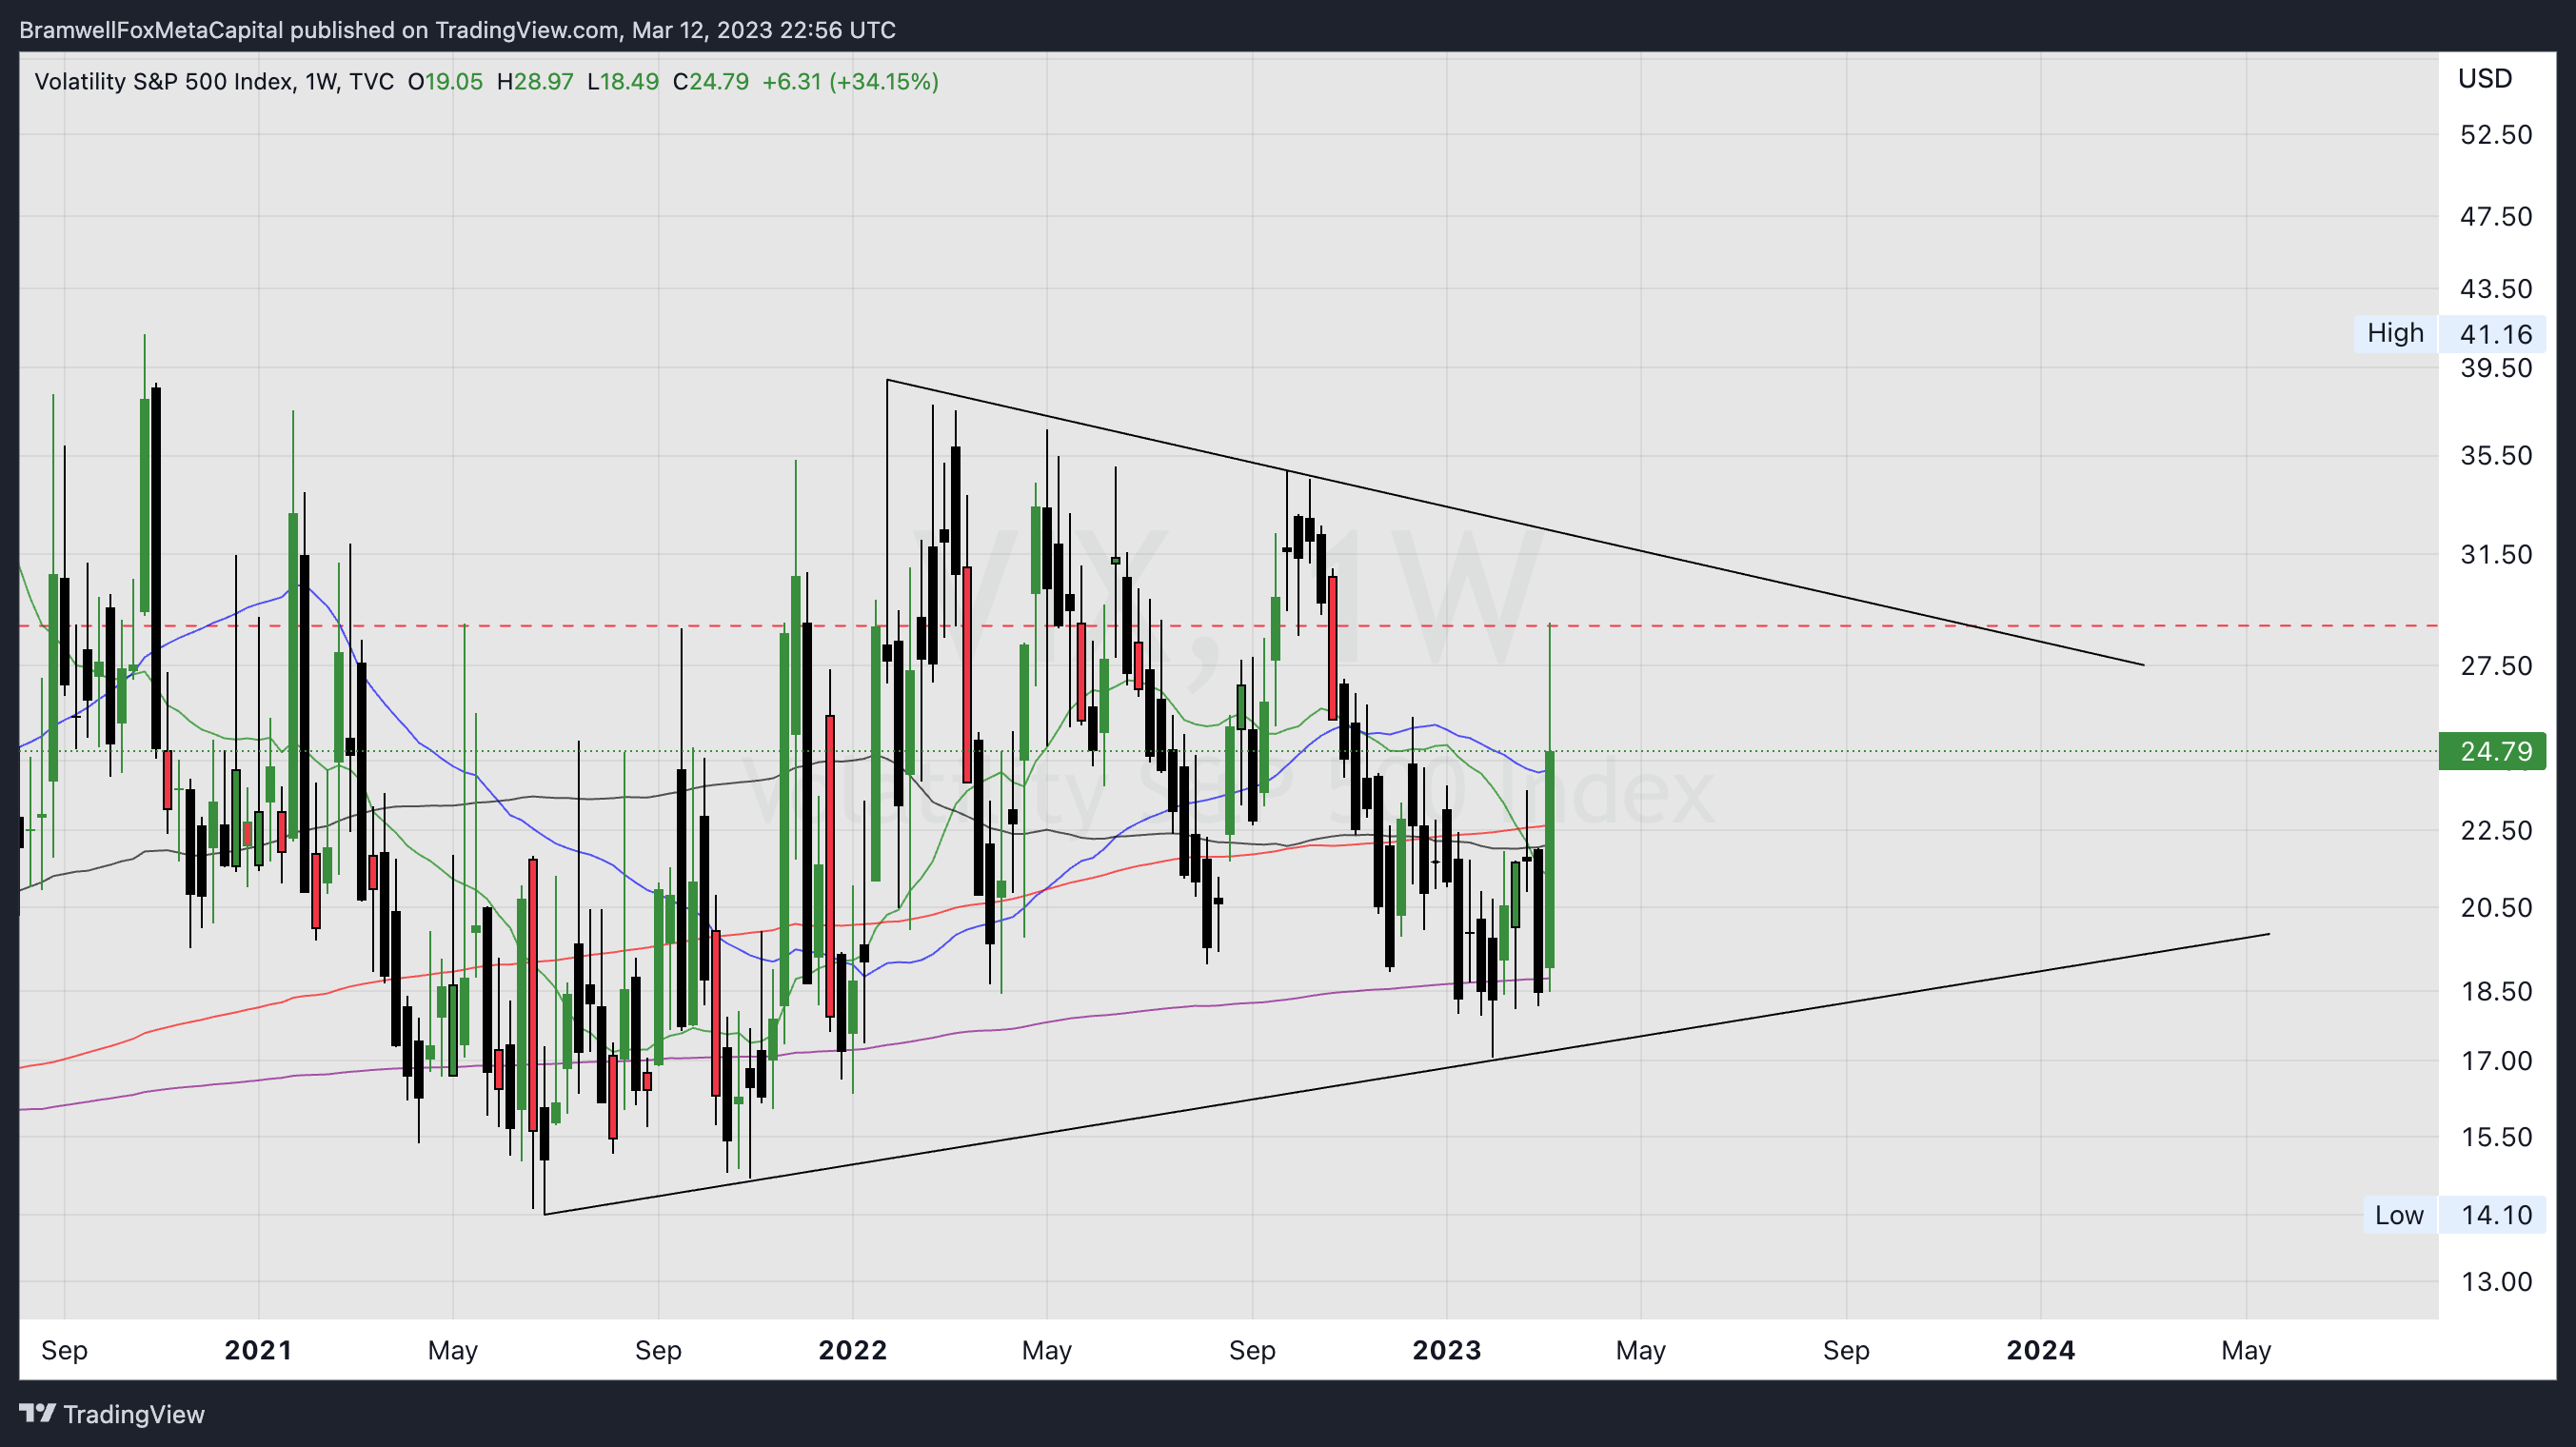
The VIX, also known as the fear index, measures the expected volatility of the S&P 500 index over the next 30 days.
Traders and investors use the VIX to gauge the level of fear or stress in the market.
A higher VIX reading is usually associated with increased volatility and uncertainty in the markets.
While a lower reading typically indicates that market participants are more confident.
The VIX has been forming a pattern of lower highs and higher lows since mid-2021, suggesting that the markets are becoming less volatile over time.
This narrowing of the infliction point may lead to a significant increase in uncertainty and bearishness leading up to the U.S presidential election in late 2024.
In the short term, last week's spike in volatility may retest the VIX lifetime median, followed by a possible resistance retest and a rejection in the weeks to come, leading to a more bullish market in April and May.
However, the long-term outlook remains uncertain, and we must continue to monitor the VIX closely for any signs of increased volatility or uncertainty.
Featured Chart VIX 1W (click to enlarge photo)
Treasuries
📉 US2YR & 📉 US10YR
💬 Matthew’s Commentary, Analysis & Prediction for the Week Ahead:
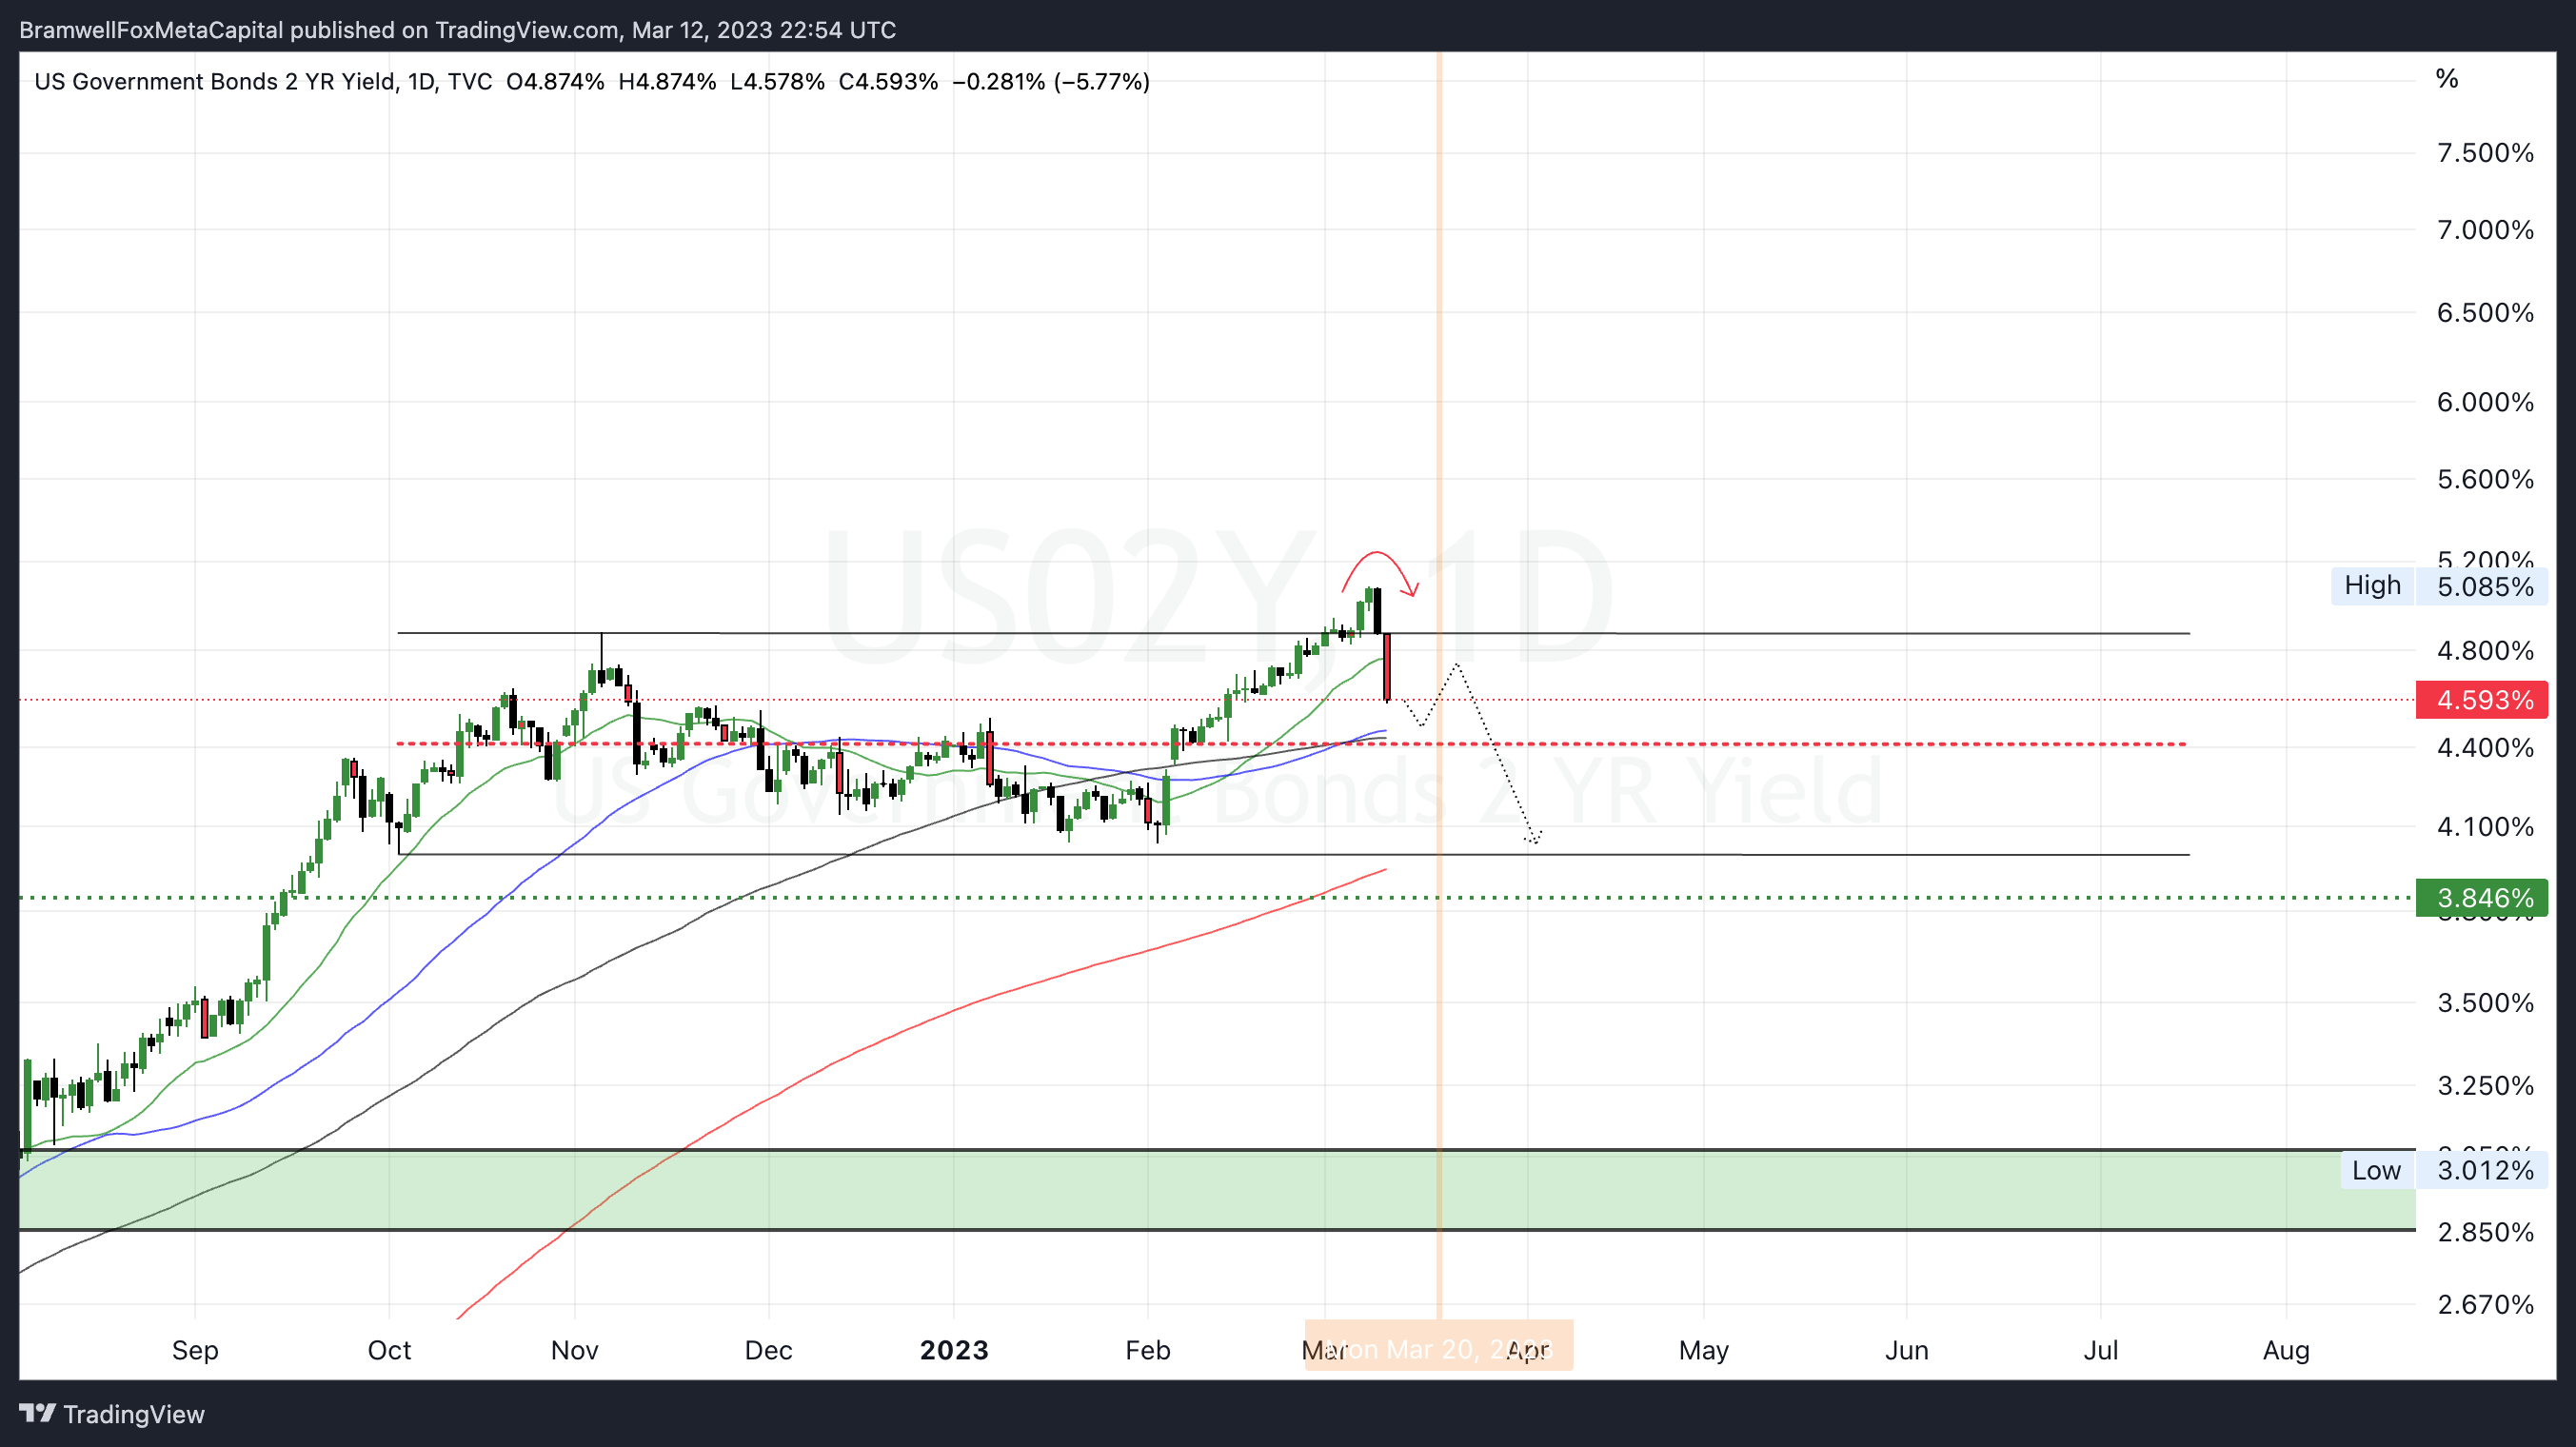
One of the most crucial charts in recent months is that of US Treasuries, particularly the inverted yield curve between the 2 and 10-year marks, which many economists believe may signal a looming recession.
As predicted in my earlier analysis, the 2-year has formed an SFP, reaching a high just above 5%, followed by a sharp rejection towards the end of the week, indicating that yields may have hit a local top and could potentially collapse.
I anticipate that this week, the range median will be swept, and the bearish trend will continue after rate announcements on the 22nd.
Ultimately, I am targeting 4% for the 2-year and 3.25% for the 10-year in the coming weeks.
Featured Chart US2YR 1D (click to enlarge photo)
Featured Chart US10YR 1D (click to enlarge photo)

Cryptocurrencies
📈 Bitcoin + 📈 XRP & 📉 Total Crypto Market Cap
💬 Matthew’s Commentary, Analysis & Prediction for the Week Ahead:
I had been warning about a Bitcoin fair-value gap for weeks, and as the saying goes, "show me the charts, and I'll show you the news."
Well, Bitcoin has now cleared my first FVG target and is currently hovering around the mid 19K to low 22K range at the time of writing, just before the weekly equity markets open in the morning.
As a result, there are two possible scenarios that may play out, and again, the charts may be foreshadowing the news.
Firstly, it's possible that Bitcoin experiences a short squeeze to the upside, clearing out overleveraged bears who became excited over recent events surrounding crypto regulation and the liquidity and solvency issues surrounding crypto-friendly banks.
If this happens, a bull trap may form, and the next target would be to clear out the remaining FVG below in the low 18K range, which would coincide with a collapse in TOTAL and specifically the XRP VWAP around 0.25 cents.
For those who may be unfamiliar with the term, VWAP stands for volume-weighted average price, which is a trading benchmark that reflects the average price an asset has traded for over a particular time frame, weighted by the volume traded at each price level during that time frame.
On the other hand, if the most recent rally continues its strength, it's possible that the rally will continue, taking out the 400-day moving average and clearing the upside FVG that I have been watching around 27.5K.
However, higher timeframe FVGs usually get cleared, so it may only be a matter of time before the lower one is tapped.
I am currently short-term bullish on risk only because of the events unfolding today and their potential impact on how the Fed may encounter pressure to keep rate hikes as expected in March, potentially leading to a higher appetite for risk assets into Q2.
Featured Chart BTC 1D (click to enlarge photo)

Featured Chart XRP 1D (click to enlarge photo)

Featured Chart XRP 1D (click to enlarge photo)

Featured Chart TOTAL 1D (click to enlarge photo)

Commodities
📉 Oil + ⚖️ Gold & ⚖️ Silver
💬 Matthew’s Commentary, Analysis & Prediction for the Week Ahead:
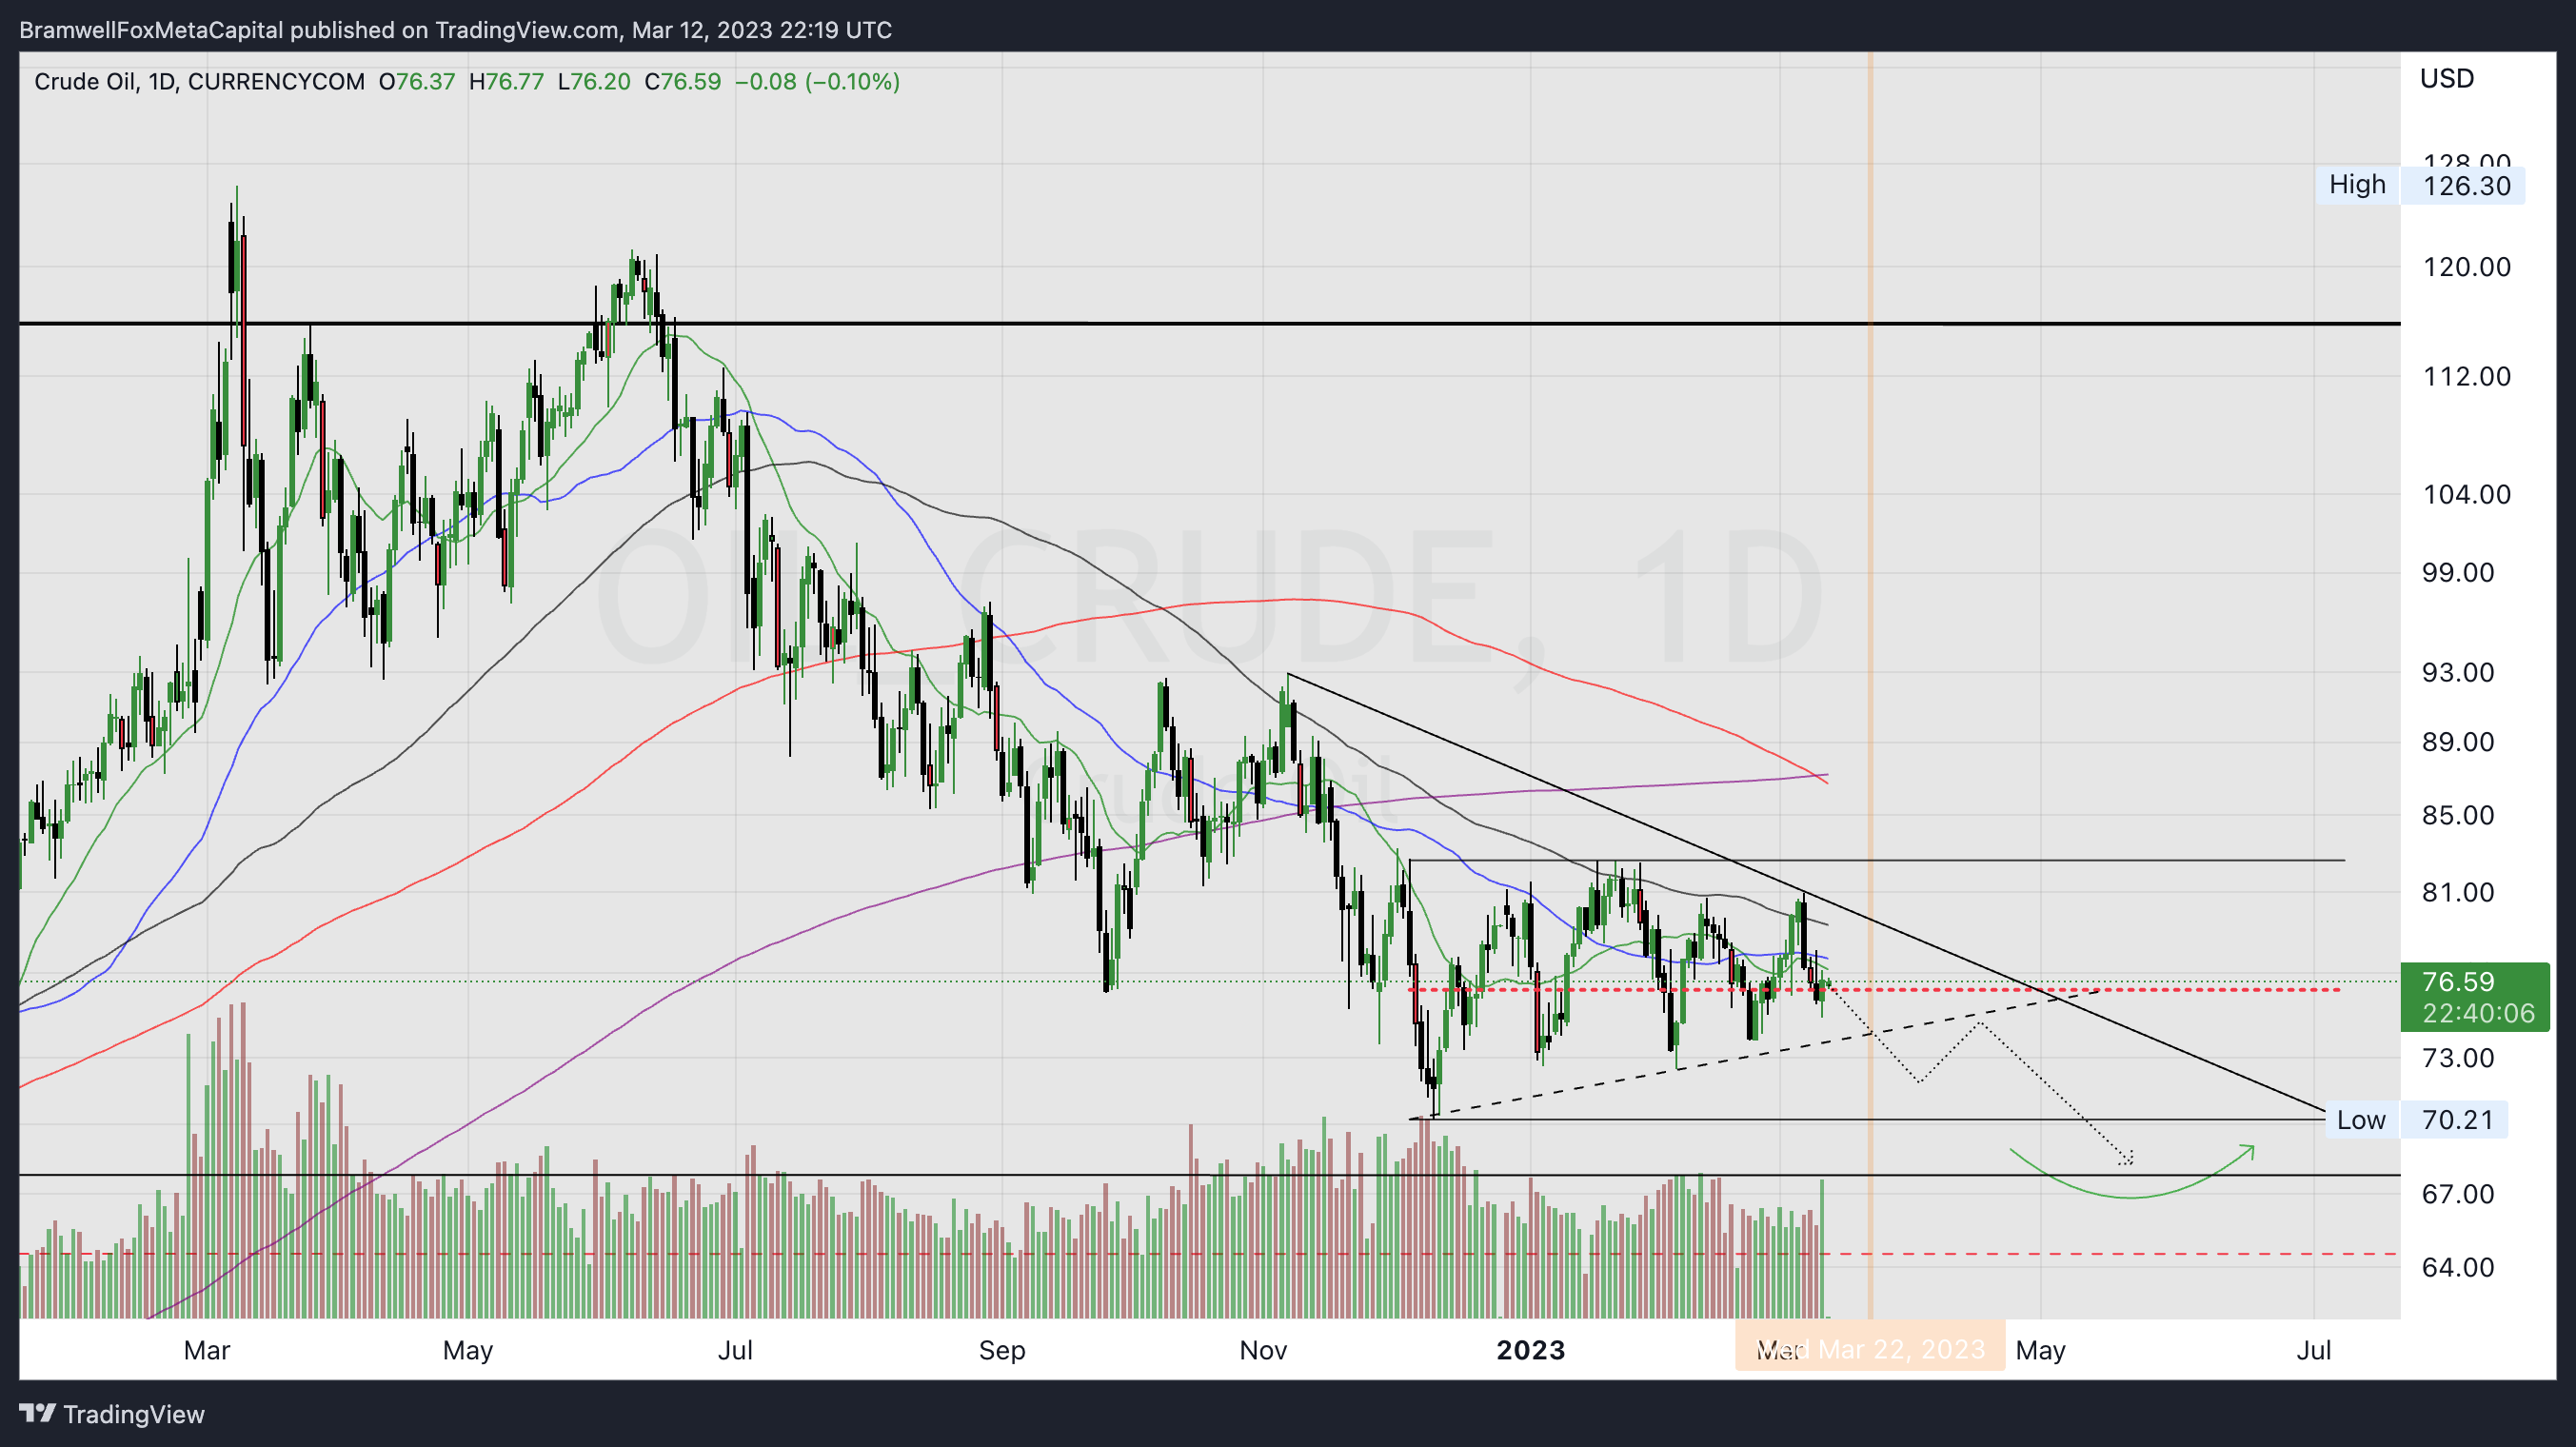
For some time now, I have held a bearish outlook on the oil market, and I still anticipate a potential breakdown in oil prices to around $65 per barrel.
It's important to keep in mind that oil prices are often linked to the value of the U.S. dollar, which is commonly referred to as the "petro dollar." As the dollar weakens, we may see a corresponding decrease in demand for oil.
It's important to remember that the relationship between oil prices and the U.S. dollar is not always straightforward and can be influenced by a variety of factors.
While the strength of the dollar can impact oil demand, other factors such as global supply and demand dynamics, geopolitical tensions, and environmental policies can also play a significant role in determining oil prices.
As an observer of the global markets, I'm keeping a close eye on the emerging renewable energy sector and its potential impact on oil prices. With more and more countries investing in renewable energy, the demand for oil may decrease over time, putting pressure on prices.
In addition, the ongoing conflict in Ukraine is another important factor to watch. If the situation escalates, it could lead to disruptions in global oil supply and cause prices to spike.
Featured Chart Oil 1D (click to enlarge photo)
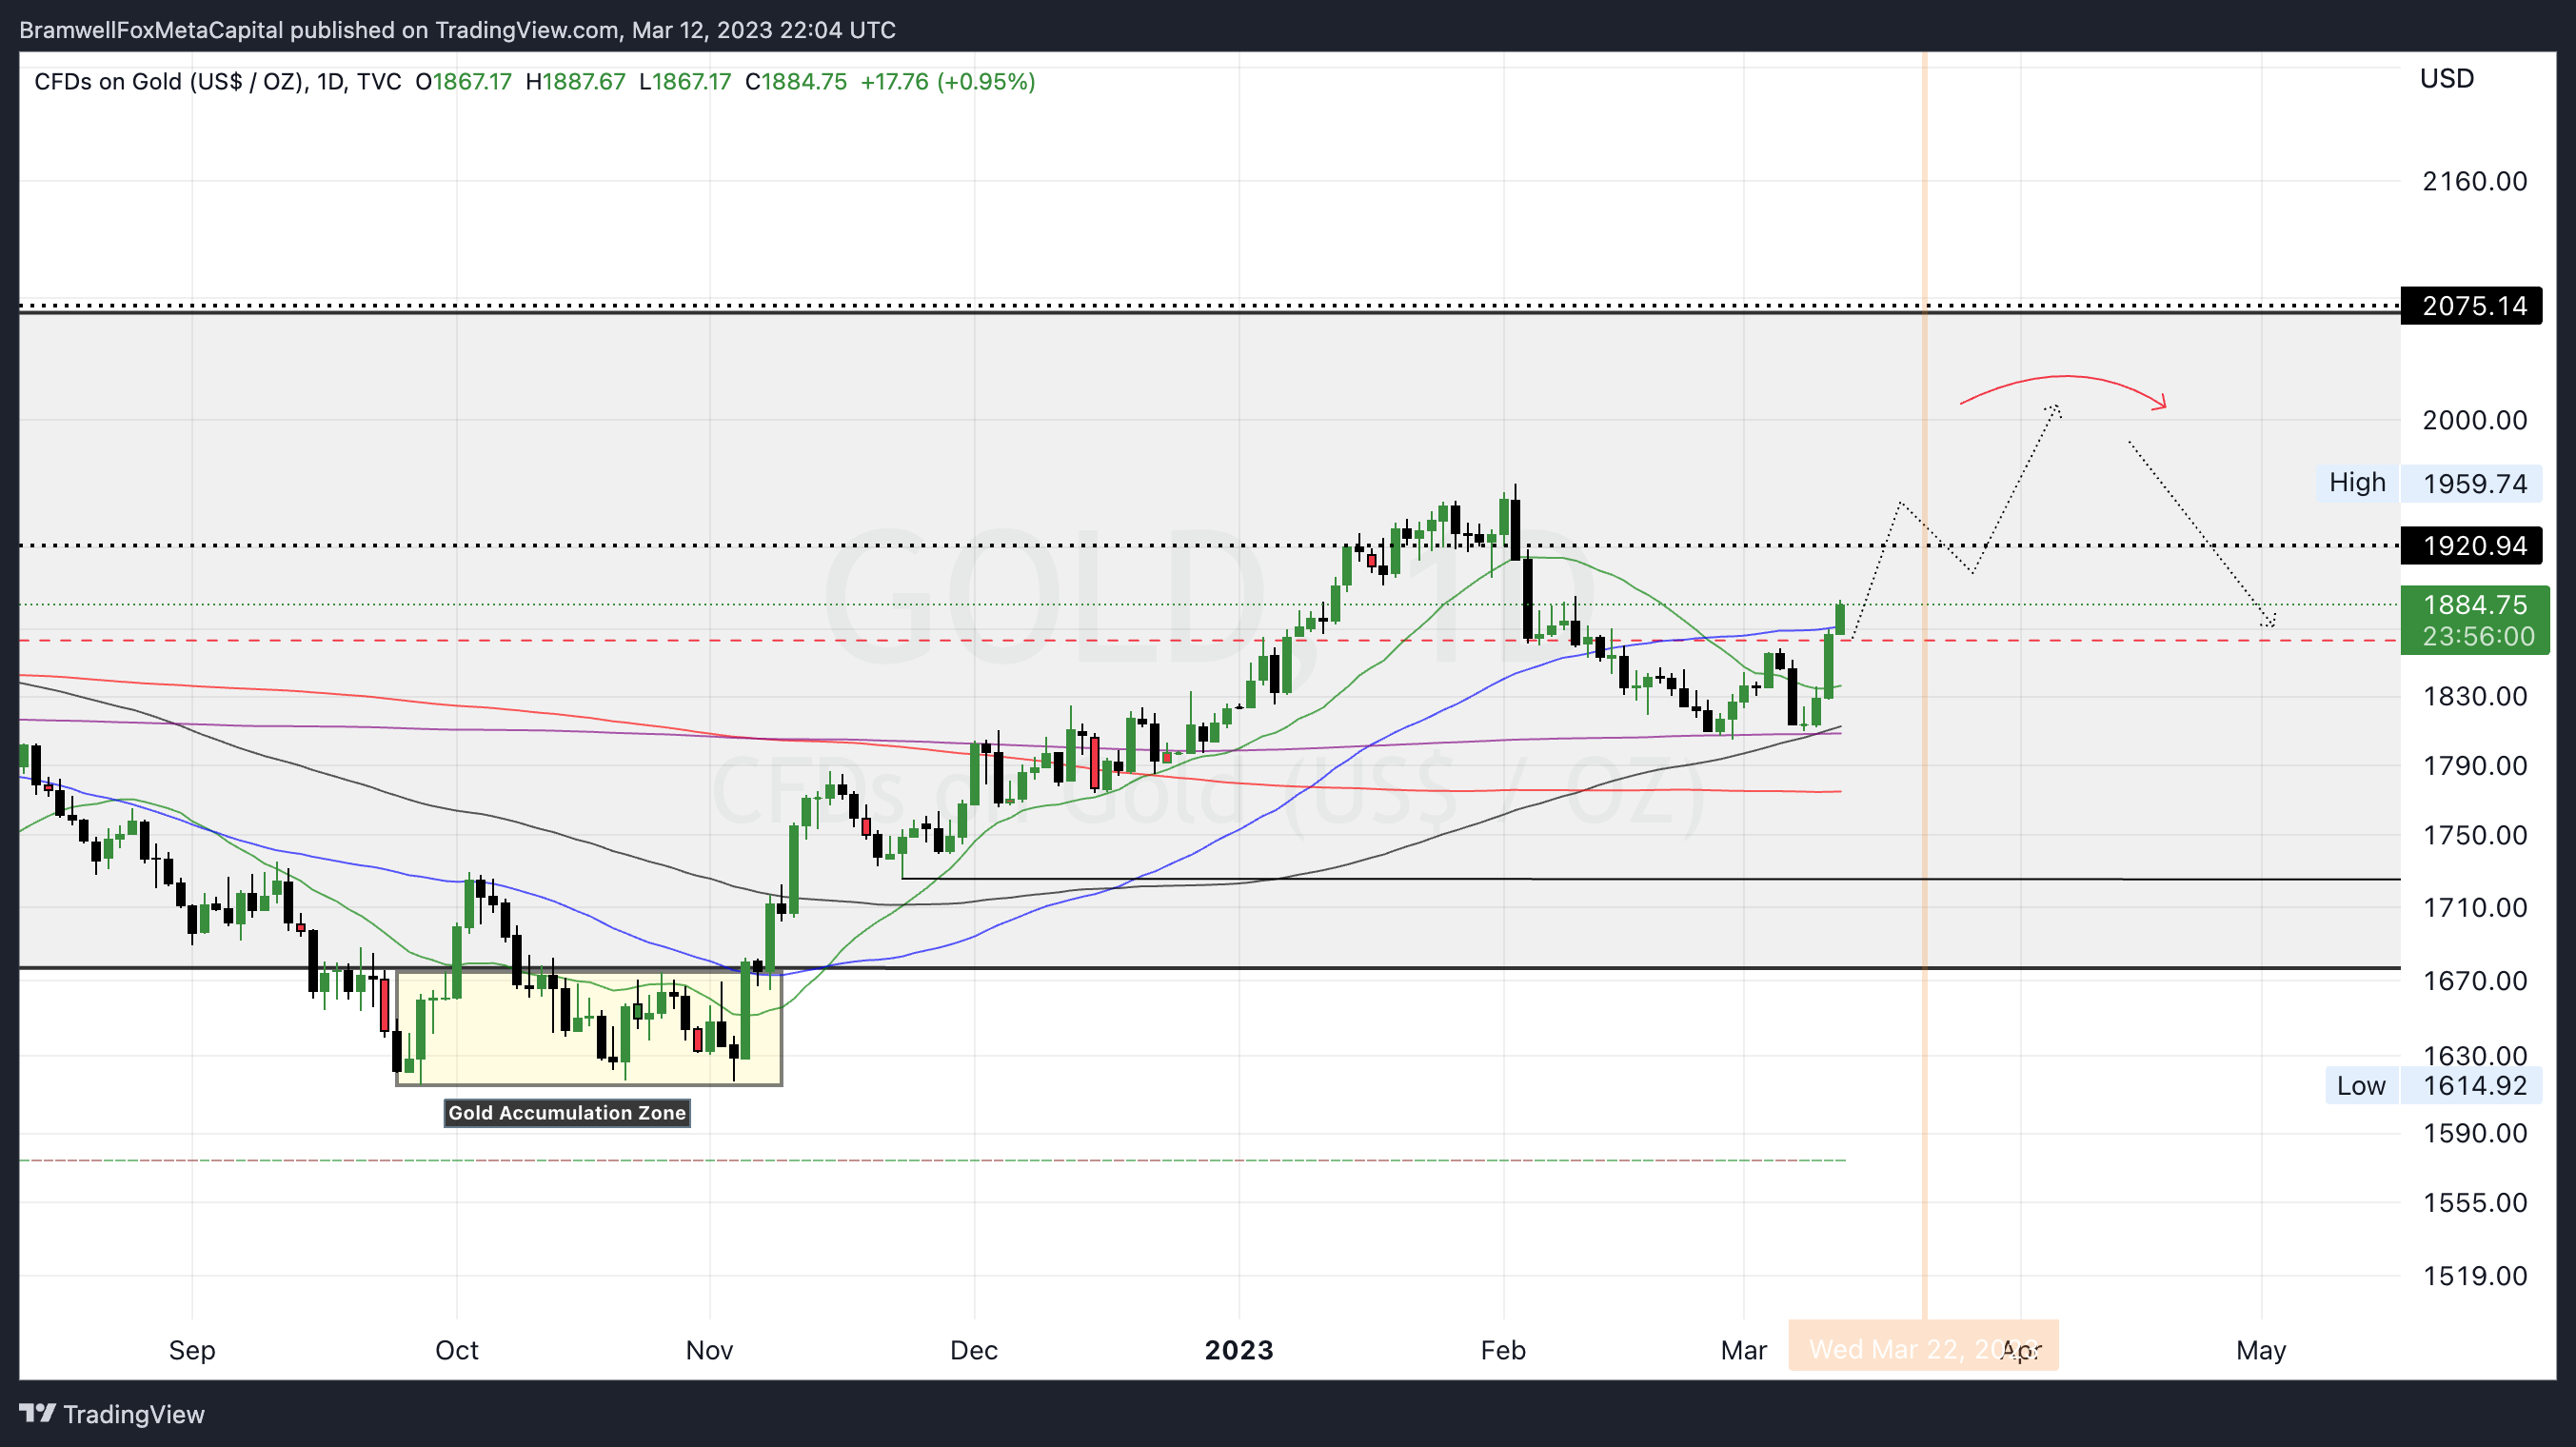
Looking at the charts for metals, gold has been trending upwards since its lows in March 2020, and it's currently trading close to $1,900 per ounce, up considerably from my long target at $1,800/oz I’ve been calling for over the past few weeks.
Should the U.S. dollar continue to weaken, there's a possibility that gold could spike up to $2,000 per ounce.
It's worth noting that silver and gold often move together, so it's not just gold that could see price increases.
Inflation and Federal Reserve policy can also play a significant role in metals pricing. Should the Fed pause rates or increase 25bps I’m for certain sure that Gold will see a huge spike in price as the DXY weakens.
In addition, there have been reports of banks around the world stockpiling gold in anticipation of a hard money system reset. This could also contribute to price increases in the metals market.
Featured Chart Gold 1D (click to enlarge photo)
Featured Chart Silver 3D (click to enlarge photo)

👋🏼 Hey!
Thanks for reading this week's Weekly Market Update Edition No. 034
If you have any comments, feedback or questions on any material written in this edition please share as I'd love to continue a dialogue below.
Leave a comment
If you enjoyed the read, I’d really appreciate if you’d share our community with your network of friends, family & fellow investors!
Share Fox MetaCapital