


🗞 Weekly Market Newsletter | Edition No. 31
News Update + A Full Analysis of Major Indices Including Stocks, Crypto, Commodities, Bonds & Forex


Monday, February 20th, 2023
Hello Friends,
I’m writing this episode just a few hours removed from my guest appearance & interview with Investing.com. They wanted to hear more about my experience as a crypto investor, trader & market journalist. Personally, I think I posed great for the cover photo.


…🤭
Now, setting aside the jokes, I must admit that the financial conditions of these markets are no laughing matter.
The media has exhausted the recession narrative, yet many traditional indicators still point to an economic downturn, such as an inverted yield curve, rising interest rates, and waves of layoffs.
However, when we look at another set of data, it reveals a thriving labor market, rising retail sales, and a higher-than-expected CPI print, causing anxiety in the markets all week.
This is all quite confusing.
Mr. Market appears to be sending bipolar signals, leaving investors around the world on edge as they try to determine which set of evidence to bet on.
Caught in the middle of it all are the retail investors, who are struggling to see through the clouds of uncertainty.
And as billions of dollars pour back into the Stock & Cryptocurrency market(s) you have to wonder if there’s a slight of hand occurring.
There’s a famous quote in trading that explains this phenomena…
"Be fearful when others are greedy and greedy when others are fearful." - Warren Buffett
Warren Buffett's quote is often interpreted as a cautionary message about how the masses often follow market trends, becoming swept up in market hype and panic, leading to poor investment decisions.
To make sound investments long term, we need to identify the hype and panic and assess which narrative is louder.
Betting against the prevailing narrative ought be the right move.
So rather than trying to predict perfect tops and bottoms, the best investment strategy we will deploy is to buy when the market is fearful and sell when the market is greedy.
This means going against the crowd and avoiding the temptation to indulge in herd discussions.
This type of market requires you to believe in your conviction, trust your intuition and often make moves that are counter intuitive to logic. It requires you to subtract data and simplify the big picture rather than add more data that adds to the mess.
If we eliminate the distractions and focus on the underlying issues, several key observations come to light.
Firstly, the United States is facing a significant financial burden due to its mounting debt crisis, a fragile democracy, and an economy that heavily relies on consumer credit lines. These are facts that cannot be ignored.
Secondly, the rise of disruptive technologies such as Artificial Intelligence (A.I) and Blockchain is adding complexity to the investment landscape. These technologies have the potential to revolutionize the way we live and work, making it important to consider their impact on the future.
Thirdly, the transition towards renewable energy sources is causing a shift in the commodity market, putting pressure on the petrodollar. This shift is affecting oil-powered industrial economies and causing them to consider new sources of energy.
Finally, there is a growing lack of confidence in figures of authority, ranging from the government to local police. This is a noteworthy trend as only a select few hold control over a vast majority of the population. Uprisings against the established system are becoming increasingly common, and this may have significant implications for the future.
In light of historical patterns, a new monetary system and a shift in global power may be on the horizon.
By removing the distractions we are able to focus our attention on what is actually occurring behind the scenes and leverage this perspective to aid us in analyzing where to invest our capital.
Whether we encounter a recession in the short term or the markets continue to rise is of less importance than staying true to our longer-term vision for where the world is headed - and to each their own.
In my view, I believe markets are severely discounted right now, and if I were a wholesale purchaser of investment assets, I would certainly love to keep the crowd at the door an extra 5-10 minutes while I gobble up the bargains.
Call me bullish? Maybe.
Enjoy the edition below; we'll begin with a few high-profile news headlines before jumping into the charts.
Cheers,
- Matthew
📰 Fox MetaCapital’s Weekly News Recap
You may press the 🗞 to read more about each headline.
Major News + Crypto Headlines
🗞 CPI print ran hot at +6.4%, investors faded the headline.
💭 Matthew’s Thoughts…
Inflation in the US has decreased from its peak in June 2021, but it is still high.
Nearly 50% of the increase in inflation was due to the shelter component, which is a lagging indicator and should be lower by now. Food prices, especially dairy and cereal, have seen significant increases (especially 🍳) while the prices of used cars and trucks have decreased.
Wage inflation for 30% of the population was up 6.3%, but it has not kept up with inflation over the last year.
Therefore, it’s likely the Fed will need to keep hiking to bring inflation back down to 2-3%, which will require tightening belts further.
If this is true, the lead up to March FOMC will be important to monitor how the markets move in anticipation of a surprise 50bps vs. the 25bps that has been priced in.

🗞 Retail Sales Soaring - but isn’t everyone broke?
💭 Matthew’s Thoughts…
In my introduction I asked how the recession narrative could be true given a record jobs increase and now a huge jump in retail sales.
I’m only curious about this as for the most part the general consensus in society is that 65% of North Americans are supposed to be living paycheck to paycheck on top of rising costs and inflation that has driven consumer savings into the ground.
So where is the spending coming from?
Allow me to propose a different perspective rather than try to dig into where the money tree is located.
Instead of looking at all of these data releases and taking them for face value, it may be insightful to ask how the data is being presented and manipulated to portray a specific narrative.
It’s worth considering this speculated slight of hand effect as even in this months CPI data we experienced a brand new methodology behind how they will be calculating the number. Maybe those in power are doing their best to keep all calm by changing few decimals here or there and painting a rosy picture?
But in the end if the data don’t fit, you must acquit.
Meaning if something feels off, it likely is.
But who’s paying attention anyways…


🗞 Ray Dalio wrote the book ‘A Changing World Order’ - he’s the expert.
💭 Matthew’s Thoughts…
When I asked “…but who’s paying attention?” I already knew the answer, Ray Dalio is.
He wrote the book ‘A Changing World Order’ where he outlines the successive phases of a what leads an economy to it’s golden ages and then to it’s utter doom.
What was his prediction?
That the U.S is en route to losing their privilege of weaponizing the U.S Dollar vs. the rest of the world and that very soon rising powers such as India and China may take centre stage as the leading global economies.
It’s interesting timing for him to express such concern over the massive amounts of liquidity being injected into the system by the United States as on the other side of the fence us Crypto investors have been speculating on Central Bank Digital Currencies for a long time.
It really does appear to me that pressure is building and those ‘in-the-know’ are beginning to place their bets before the news breaks - follow the money.

🗞 2008 was a Housing Bubble; 2023 is a Credit Bubble on Steroids.
💭 Matthew’s Thoughts…
The recent trends in revolving credit lines and personal savings rates in the US have significant implications for the economy.


The chart clearly shows that revolving credit lines are increasing while personal savings rates are collapsing. This is concerning as it suggests that consumers are becoming increasingly reliant on credit to finance their spending.
Revolving credit lines, which include credit card debt, are the lifeline of the dollar as rising costs have eliminated the ability for consumers to bank their wages.
With wages failing to keep pace with inflation, consumers are turning to credit to maintain their standard of living.
This is a worrying trend as it indicates that consumers are living beyond their means and are at risk of falling into debt traps.
The trend is clearly not sustainable, and it is likely to have significant long-term effects on the economy. High levels of consumer debt can lead to defaults, which can have a cascading effect on the broader economy.
For example, when consumers default on their loans, banks and other lenders are at risk of losing money. This can lead to a credit crunch, where lenders become more cautious about lending money. This, in turn, can lead to a slowdown in economic activity, as businesses find it harder to borrow money to invest in their operations.
Furthermore, as consumers become more indebted, they are likely to cut back on spending, which can lead to a contraction in demand.
This can have a negative impact on businesses, which may be forced to cut back on production and lay off workers. This, in turn, can lead to a vicious cycle of declining economic activity and rising unemployment.
So is the economy actually running hot, or running itself into the ground?
This is part of seeing through the clouds I’m referring to above.
The economy is not healthy right now, but the U.S Government is in a pinch as continued interest rate hikes forcefully create political tensions and exasperate the civil issues at hand, meanwhile all other actions lead to a collapse in the value of the U.S Dollar.
Which do you think comes first?
🗞 Charlie Munger vs. Michael Saylor on Cryptocurrencies - worth the watch.
💭 Matthew’s Thoughts…
I’m no Bitcoin aficionado, but I have to admit that Michael Saylor expresses his thoughts on digital currencies, especially Bitcoin, with remarkable eloquence.
It seems that technology will drive our financial system towards this direction, and Saylor has provided some compelling reasons to support this view.
Listen to the article below, it’s a beautiful work of art and should give you confidence in why we invest in blockchain.

Fox MetaCapital’s Weekly Asset Review + Technical Analysis
📈📉 The Week Ahead in Charts
Symbols 📈 or 🐂 = Bullish / Positive | 📉 or 🧸 = Bearish or Negative | ⚖️ Ranging or Low Volatility
FOREX
📉 DXY(U.S Dollar) + 📈 CAD
💬 Matthew’s Commentary, Analysis & Prediction for the Week Ahead:
Bullish on the DXY? - I'd be cautious.
On the technical outlook;
We've just re-entered the 8-Year Monthly Range and this bearish re-test could face a rejection from the range high. Adding to the confluence of this bias are multiple high time frame fair value gaps that lay below awaiting to be cleared.
It’s worth noting that the .618 Fibonacci re-tracement pocket is located close to monthly range median (~.98) and typically this is a golden zone for price movement - I'm expecting further downside in the short term.
From a fundamental standpoint, it appears the markets are losing confidence in the U.S Dollar in the short term hedging that the FED will have no choice but to continue with the already priced in 25 bps hike in March.
However, you’ll notice I have two vertical orange lines on the chart to mark where the FOMC events occur and I’ll be watching closely for any suspicious movements across all indices that may indicate that money ‘‘in-the-know’ has heard rumours of a hawkish surprise on the horizon.
Featured Chart DXY 1M (click to enlarge photo)

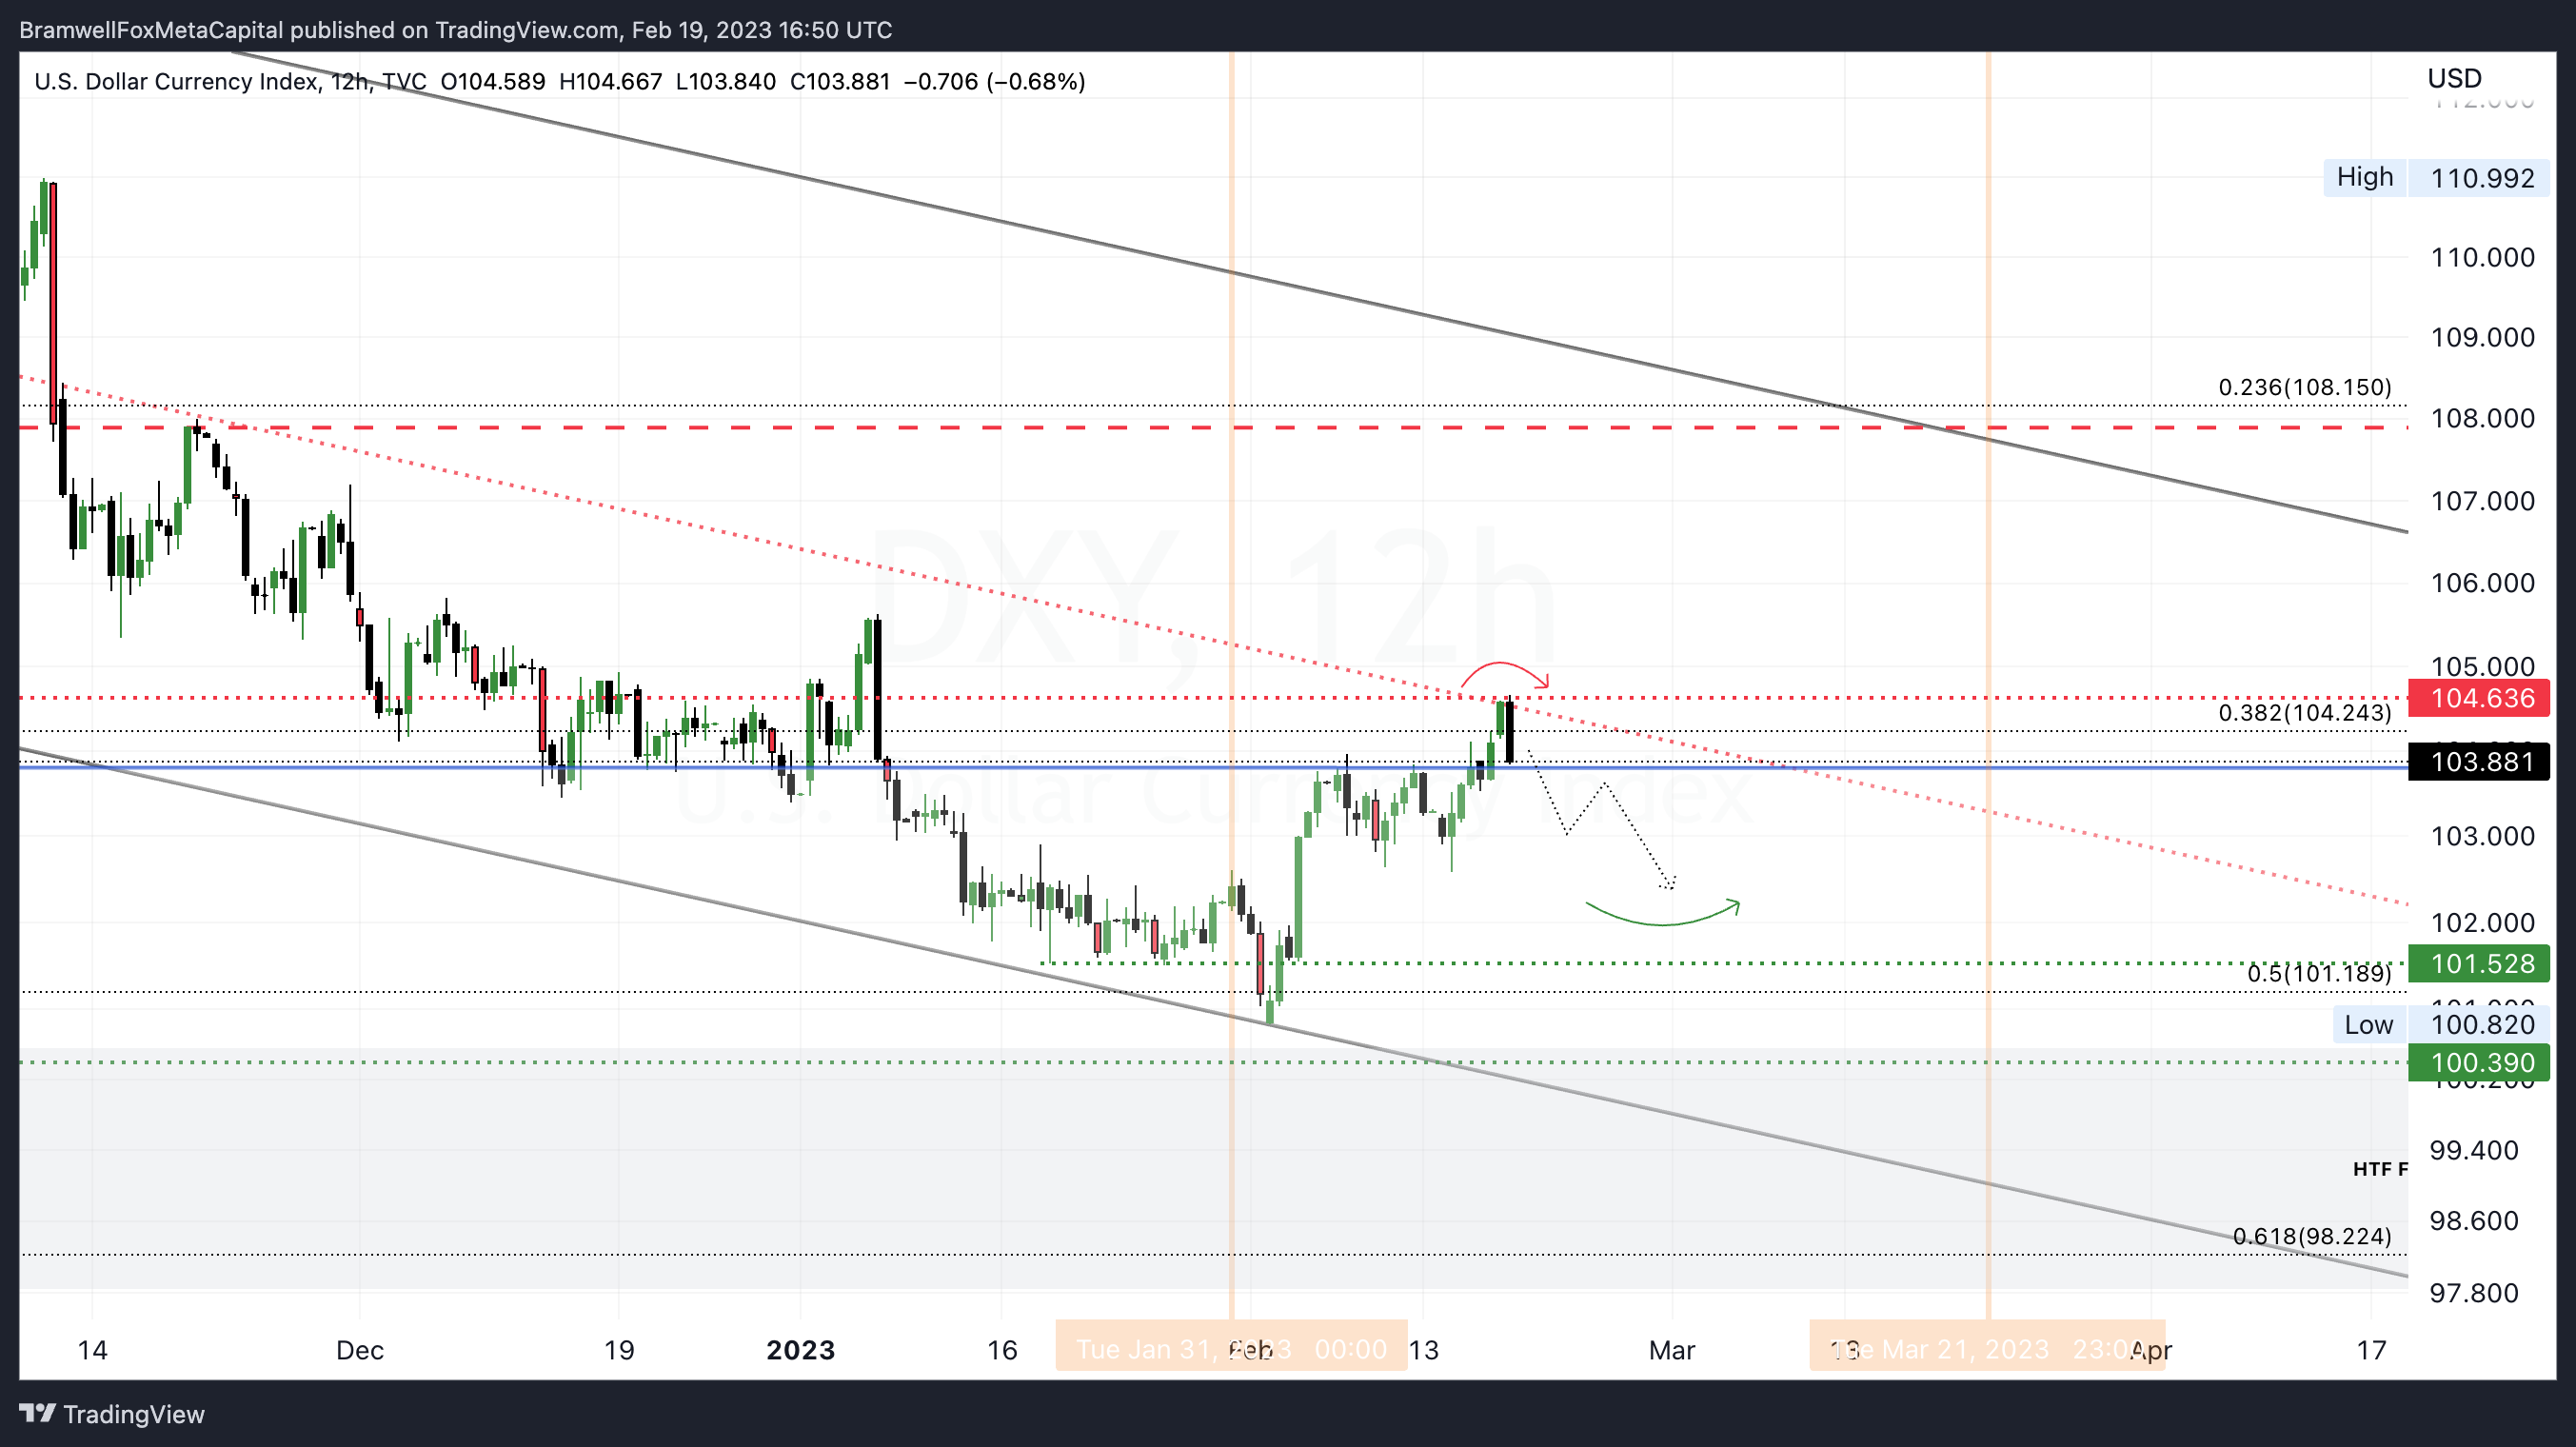
Zooming in on the DXY as we head into this week, I’m looking for a short period of consolidation around the blue range high followed by a sell off as the week unfolds.
I’d expect for the DXY to end the week just above 102.
Featured Chart DXY 12HR (click to enlarge photo)
The Canadian Dollar has been respecting this trendline for ~6 months and I see no reason to short it.
A rising triangle formation is typically bullish and I’m still expecting in Q2 for the $CAD to break above .75 and continue it’s strength against the U.S Dollar.
Featured Chart CAD 1D (click to enlarge photo)

Equities
📉 S&P500 + 📈 TSX + ⚖️ VIX
💬 Matthew’s Commentary, Analysis & Prediction for the Week Ahead:
You’ll notice across the majority of the charts I’m drawing that I’ve shown the vertical FOMC line in orange.
That’s because I’d expect for each major indice and currency to be at an infliction point of max fear / greed leading into these events.
For the S&P500, my outlook is it will continue to fill the rising wedge and challenge the Daily 400 MA (purple) before a short selloff around March 20th has investors on edge on what next move the FED will make.
For the next 2-3 weeks I’m expecting earnings releases to create the volatility needed to print this price movement.
Featured Chart S&P500 1D (click to enlarge photo)

On the 2D chart the TSX is looking strong.
Recently, it climbed above 20,500 and is looking to confirm support along this multi-year range low.
The moving averages are all in favor of continued bullish action for the TSX, and I would expect it to respect the trend line until it reaches the lows of 21K, awaiting end-of-quarter financial reports and a confirmed direction of international monetary policy to assess risk appetite for equities.
Featured Chart TSX 2D (click to enlarge photo)

Last week the VIX formed a swing pattern failure at the range high’s and I was curious if the downward shift in momentum would send the VIX into the 16.25 region.
Rather, the FIX bounced from the range lows and now we await the confirmation of a lower high and reversal to the range low, or a breakout to the upside.
The VIX determines market volatility and typically inverse related to price of the S&P; ie. a rising VIX is bearish, a falling VIX is bullish.
Featured Chart VIX 1D (click to enlarge photo)

Treasuries
📉 US2YR & 📉 US10YR
💬 Matthew’s Commentary, Analysis & Prediction for the Week Ahead:
The most important chart(s) of the week will be the U.S treasuries yields.
As we speak both the 2-Year and 10-Year are facing critical resistance.
If broken to the upside, it would signal continued sell-offs of U.S debt and make me question the confidence global investors have in the true strength of the U.S economy.
We can use charts like these to help clear the cobwebs of the media’s message of a thriving economy and look at what big money players (institutions and foreign governments) are actually thinking is happening behind the scenes.
I’m personally expecting a rejection from this range high which ought to be bullish for risk assets as a fall in yield would strength the appetite for continued capital rotation into risk.
Featured Chart US2YR 1D (click to enlarge photo)

Featured Chart US10YR 3D (click to enlarge photo)

Cryptocurrencies
📈 Bitcoin + 📈 XRP + 📈 Total Crypto Market Cap
💬 Matthew’s Commentary, Analysis & Prediction for the Week Ahead:
Bitcoin has been a monster asset in 2023, but the rally may soon come to an end.
Keep an eye on the timing of the March FOMC meeting and the anticipated direction for Bitcoin and the crypto market.
I believe there will be one last push up into the 27.5K range, forming a short-term bull trap before a Bitcoin sell-off occurs due to taxes and hedging against a hawkish FED surprise.
Featured Chart BTC 1D (click to enlarge photo)

Although most assets will follow Bitcoin's path, XRP is expected to experience an intense month in March due to the Ripple vs. SEC case, which is expected to finalize before March 30th.
Last week, XRP broke out of the daily FVG below and formed a SFP at the range low, typically very bullish for a move in the opposite direction.
It wouldn't be surprising if XRP challenges the range high within 7-14 days of writing this edition.
Featured Chart XRP 1D (click to enlarge photo)

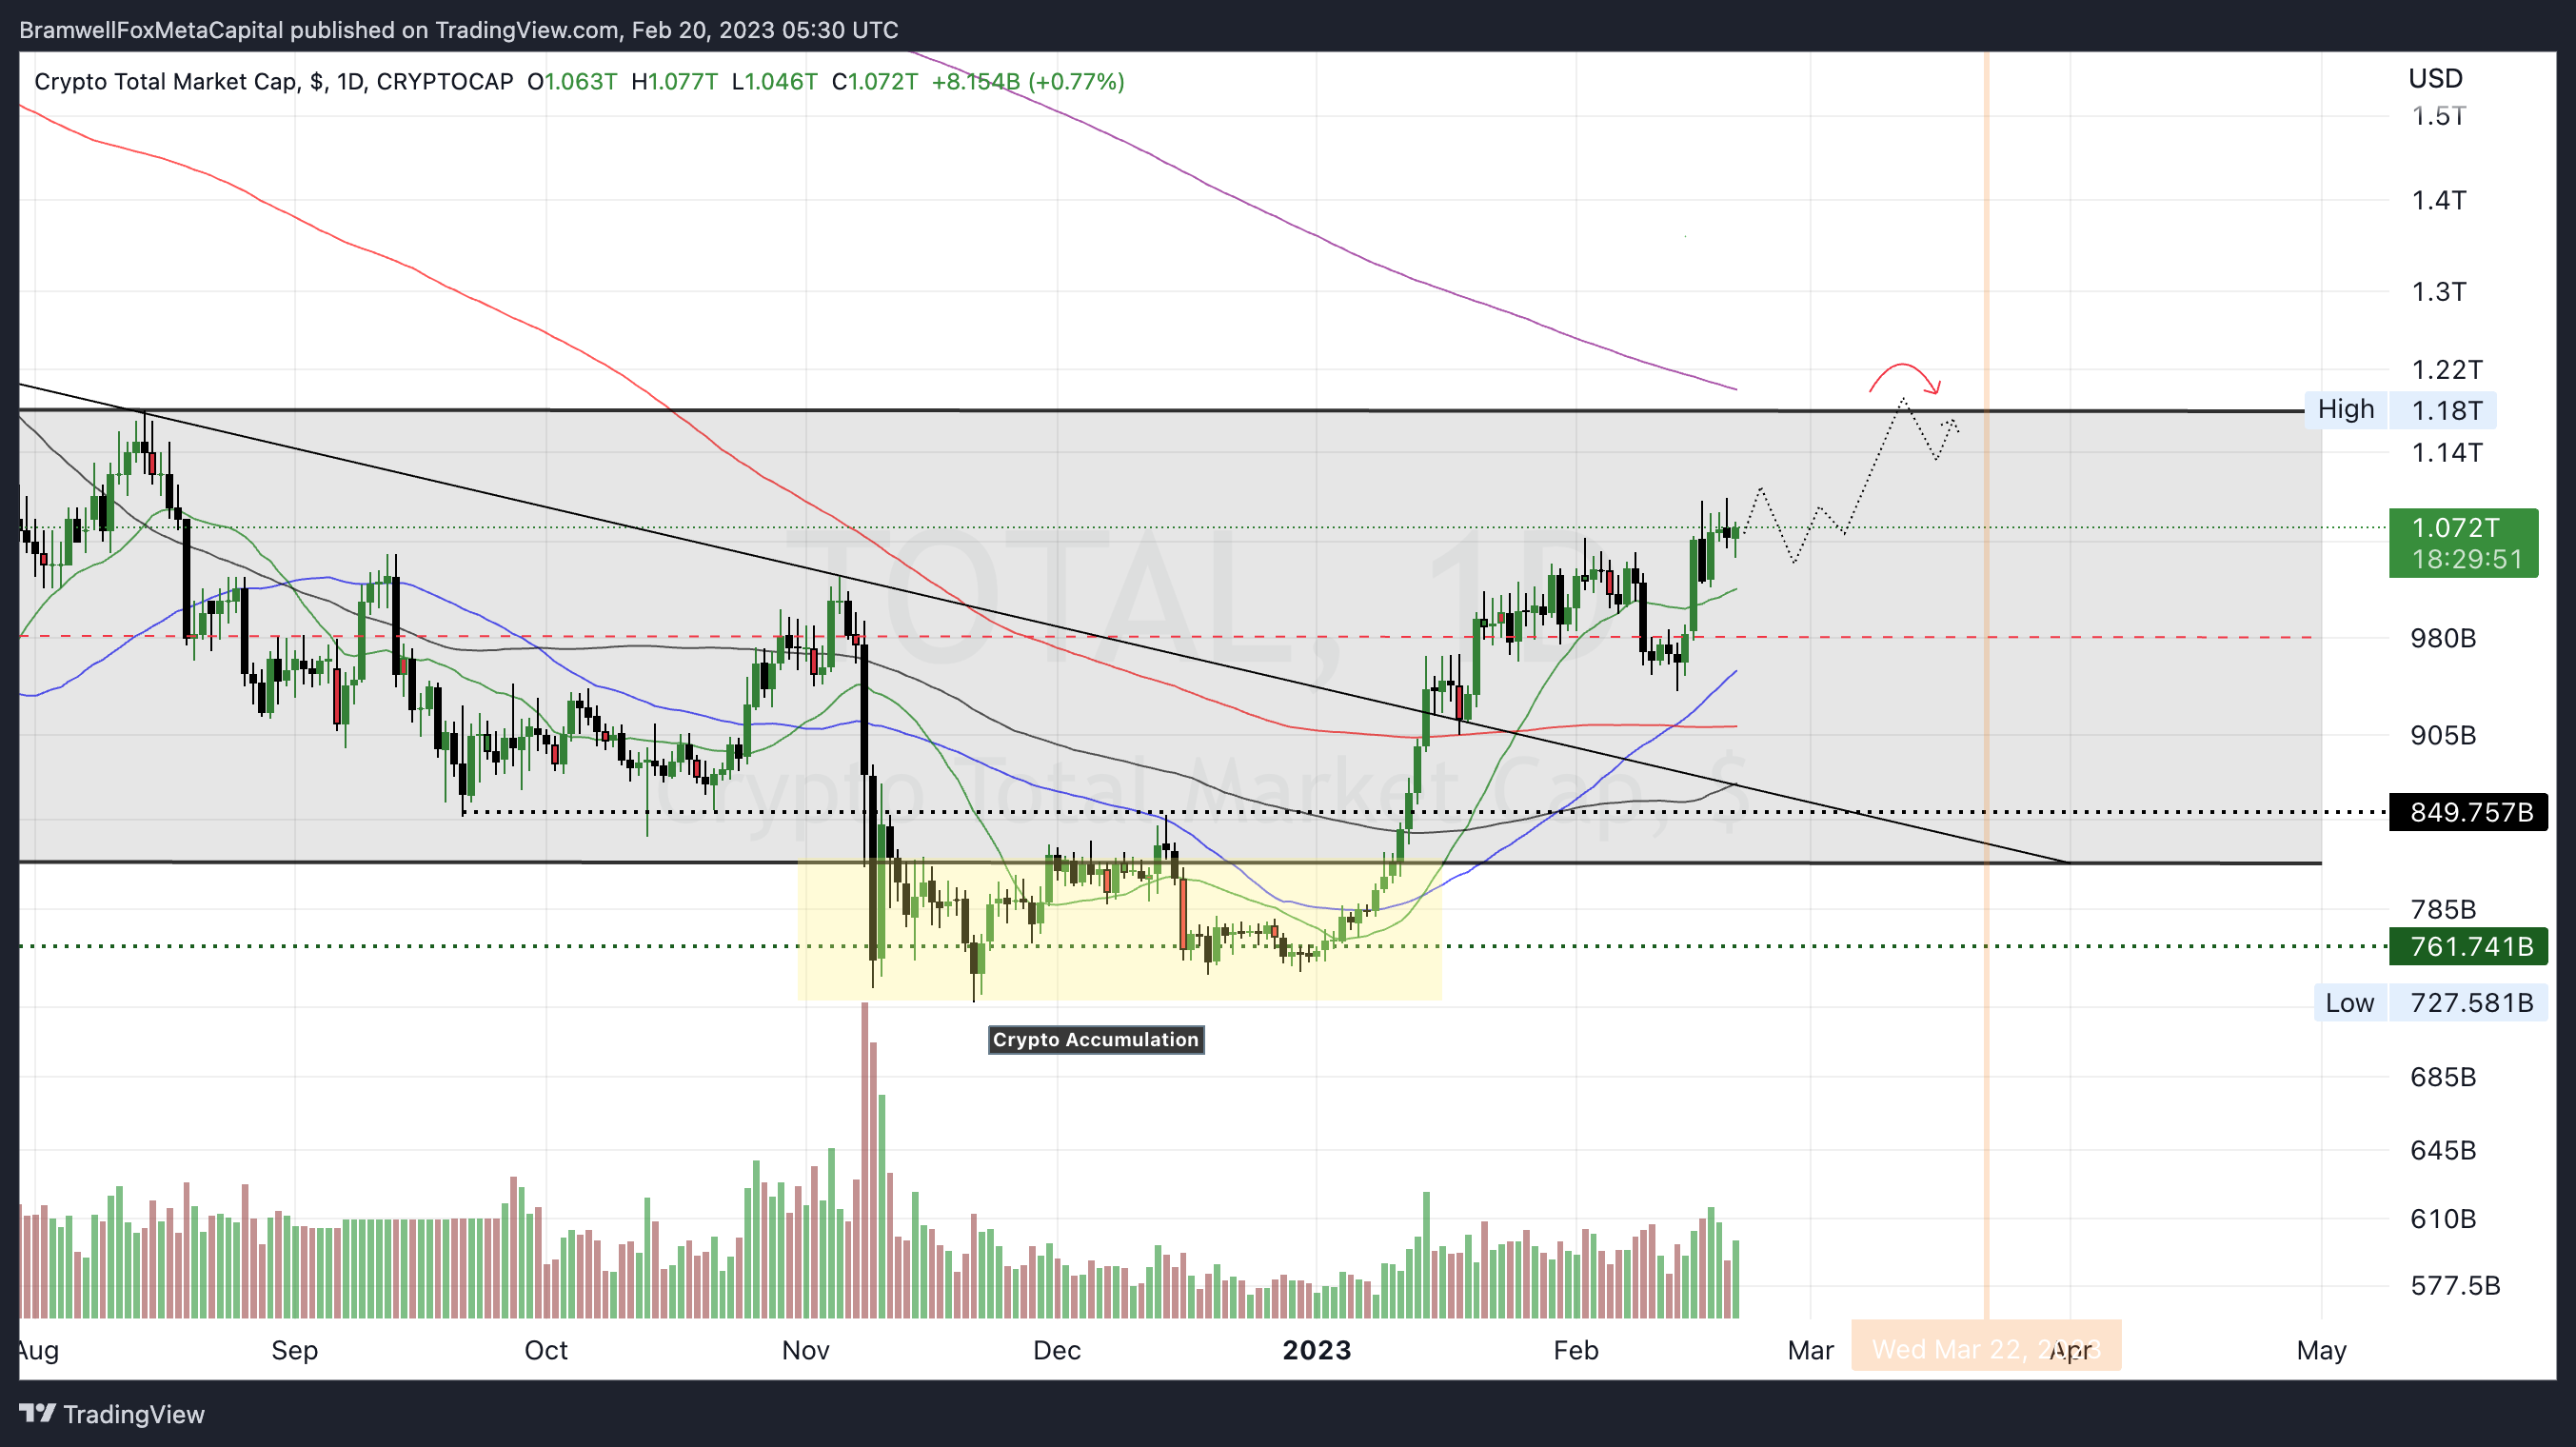
Furthermore, the total crypto market cap chart shows little resistance until the range high collides with the daily 400 MA.
I expect TOTAL to reach 1.15T in market cap within the next 7-14 days.
Featured Chart TOTAL 1D (click to enlarge photo)
Commodities
⚖️ Oil + ⚖️ Gold & ⚖️ Silver
💬 Matthew’s Commentary, Analysis & Prediction for the Week Ahead:
In terms of commodities, it's crucial to monitor Gold, Silver, and Oil given the current global economic conditions.
Oil is ranging between $72.5 and $82.5, and when volatility contracts within a range, an aggressive price movement typically follows.
My bias for the last 6 months has been a $65 per barrel oil price, so I'm looking for the reaction from the outer trendline when Oil reaches within 6-8 weeks.
From there, it ought to retest the weekly range high or collapse into new support.
Now which headline will add fuel to this move, that’s the part i’m interested in watching.
Featured Chart Oil 1D (click to enlarge photo)

Metals are continuing their close watch of the Dollar and inflation, as are we.
I believe Gold is entering one last accumulation range before breaking to new highs and this adds evidence to my theory of a medium to long term collapse of the dollar.
Adding sport buys at 1.8K may be the last time to mine a nice swing trade or portfolio allocation before 2K per oz comes in hot.
Featured Chart Gold 1D (click to enlarge photo)

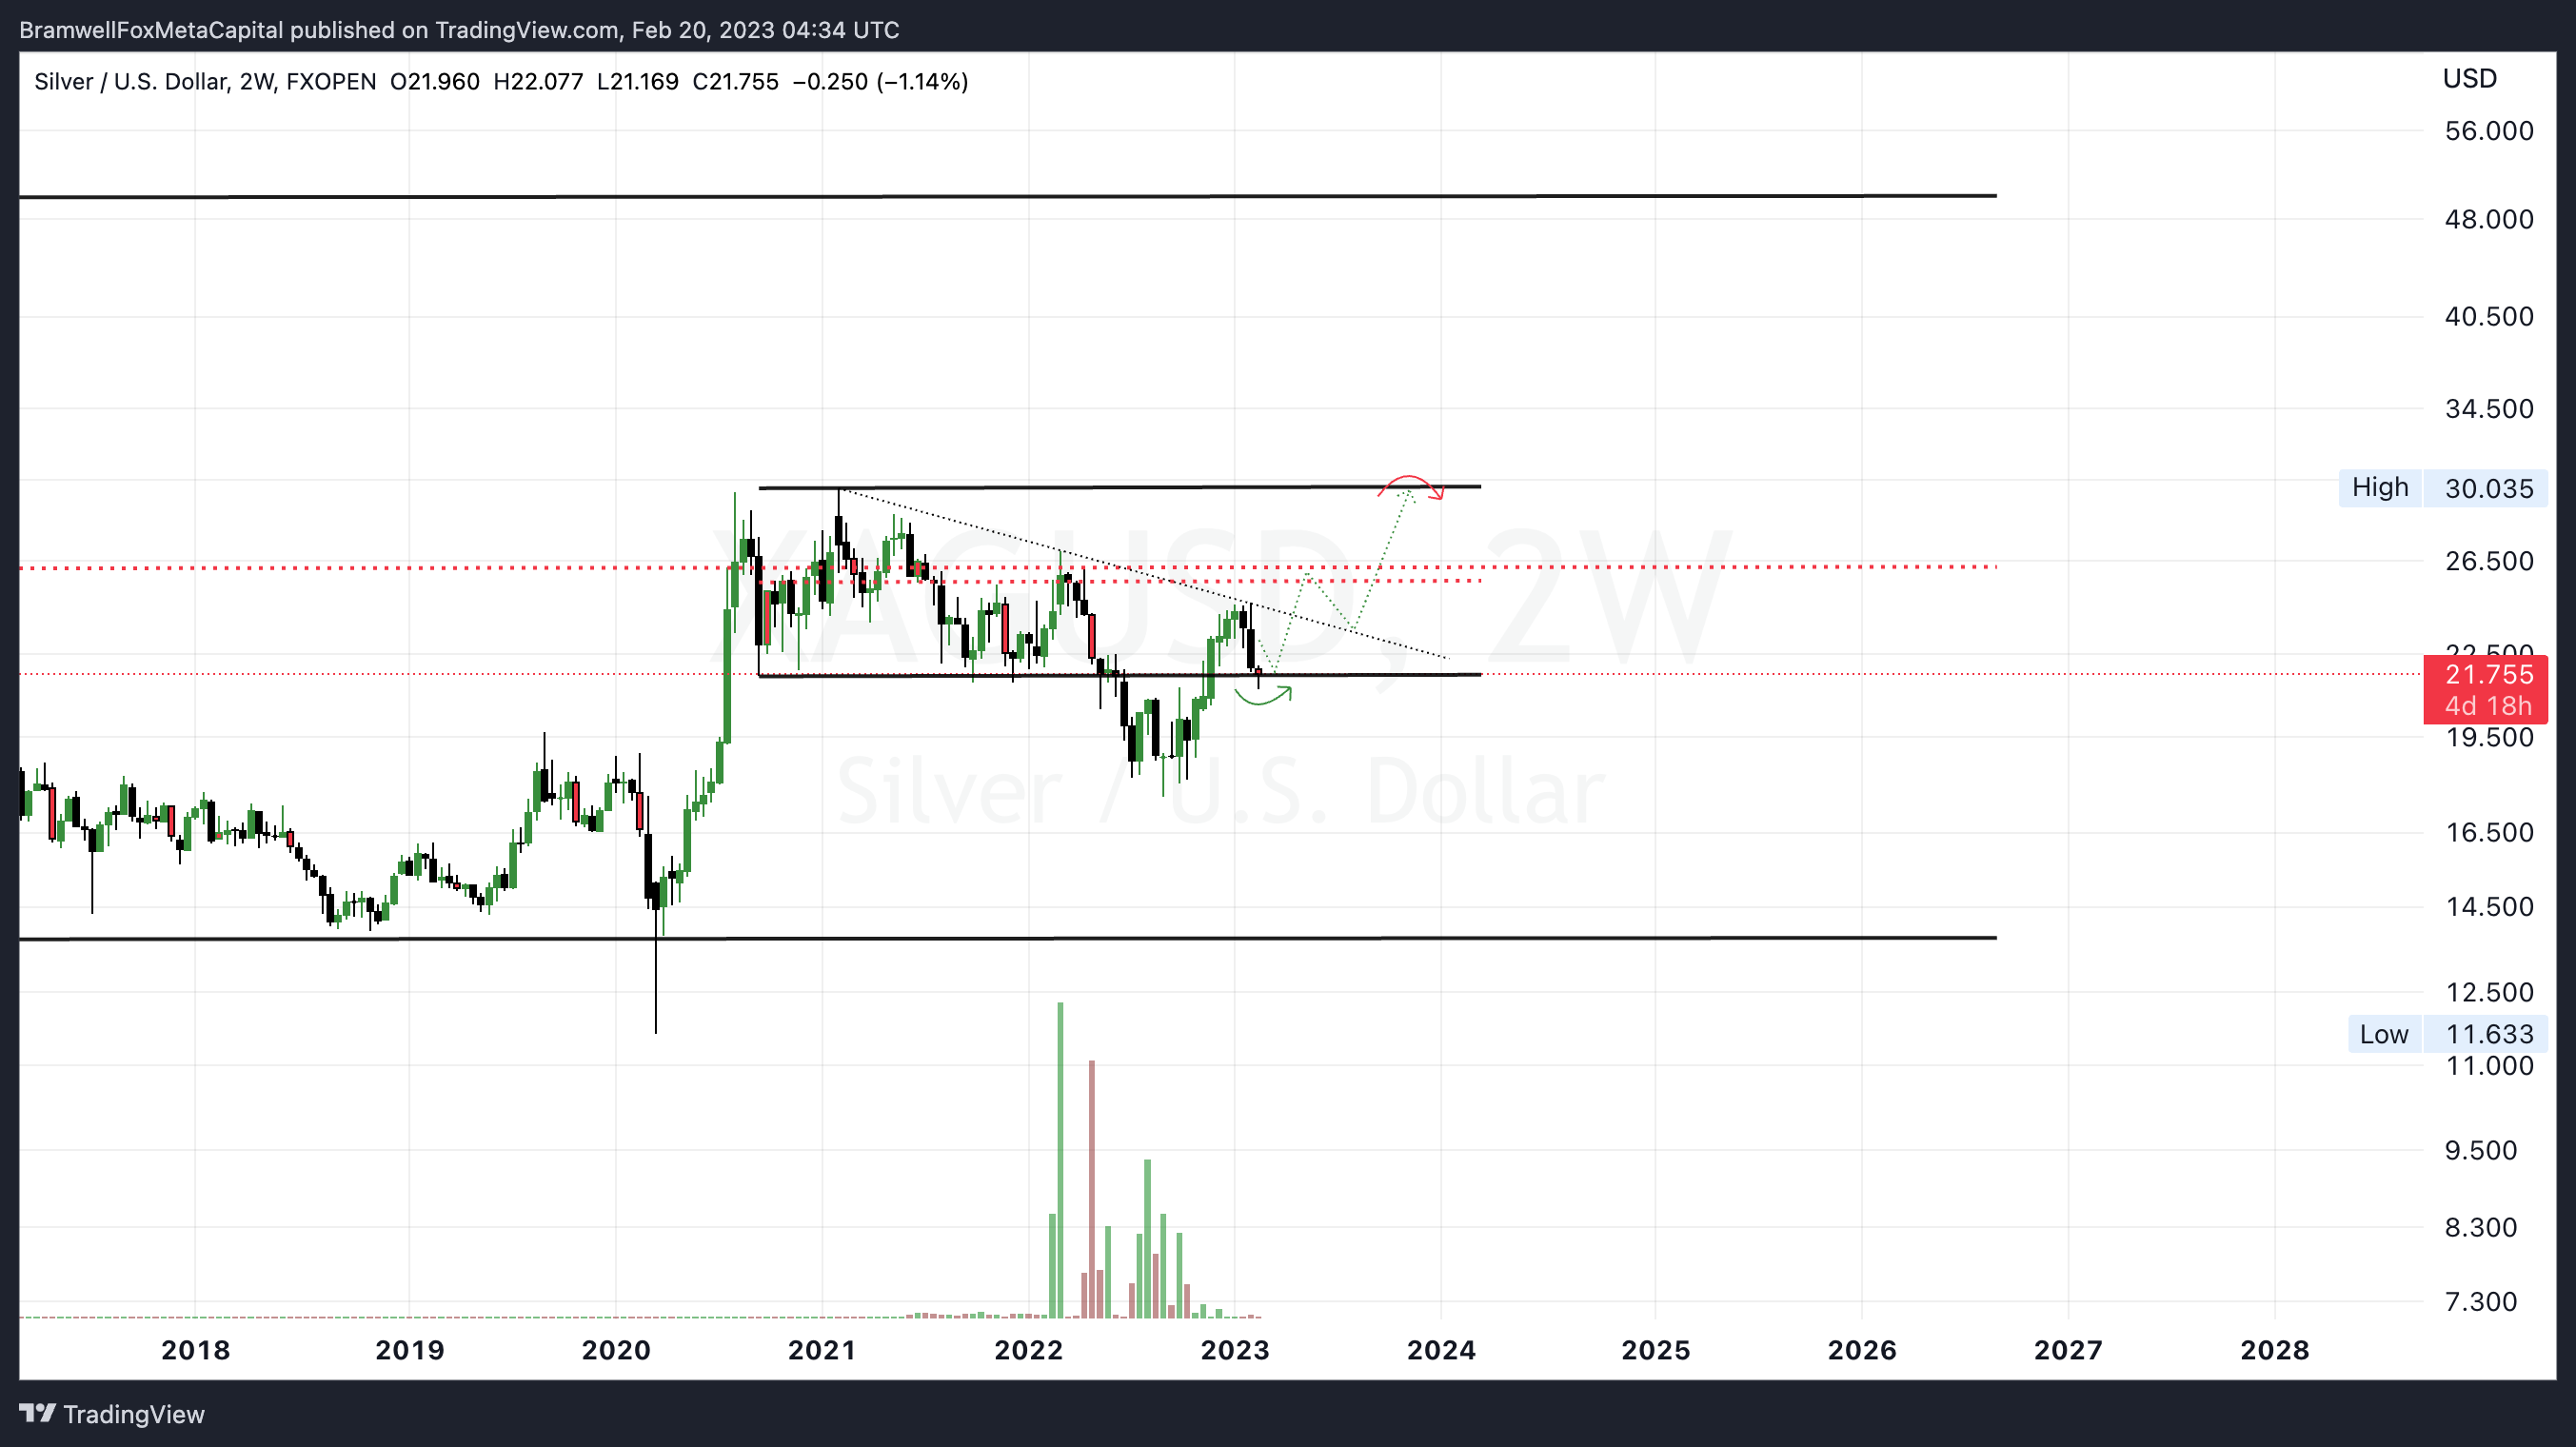
I believe Silver is forming a slingshot SFP at the bottom of this range and likely to soar 30% by end of year.
Currently on the 2W timeframe Silver is consolidating at the ranges lows and recharging liquidity for it’s next move upwards through resistance, into the $25 mark and then upwards to $30 by EoY.
Featured Chart Silver 2W (click to enlarge photo)
👋🏼 Hey!
Thanks for reading this week's Weekly Market Update Edition No. 031
If you have any comments, feedback or questions on any material written in this edition please share as I'd love to continue a dialogue below.
If you enjoyed the read, I’d really appreciate if you’d share our community with your network of friends, family & fellow investors!