


🗞 Weekly Market Newsletter | Edition No. 30
News Update + A Full Analysis of Major Indices Including Stocks, Crypto, Commodities, Bonds & Forex


Sunday, February 12th, 2023
Hello Friends,
How nice of the markets to celebrate the month of love 💕 with a pullback in prices across the board turning painting the week red to start February.
What actually happened can be broken down into two parts; technical and fundamental.
(Speaking of, I published Course Episode Four: Learning the Basics of Fundamental Analysis on Friday, this is a fantastic episode that will help you evaluate what’s under the hood of your investments - check it out!)
On the technical side, think supply vs. demand, the charts were overbought across the board indicating exhausted buying momentum and reduced liquidity.
From Bitcoin to the S&P500, the appetite for risk cooled as the majority of assets reached their weekly range highs and were in need of sell pressure to recharge on liquidity - nothing to fear.
Yet, it never ceases to amaze me the phrase “show me the charts, i’ll show you the news” and certainly the fundamental narratives didn’t let us down.
We have spy balloons, UFO’s, natural disasters, a grump FED Chairman, tens of thousands of tech lay-offs and artificial intelligence taking over the world - certainly these headlines created a little fear in the markets to start the month.
From a purely financial standpoint, what surprised me the most was the sell off in U.S debt creating a breakout in yields that I was not expecting. This gave the DXY (U.S Dollar) room to move up and stay up while risk assets fell in price.
Second to this, Oil surprised me by holding up well in what I thought would be a gradual path to $65.00 which as me speculating we will see further headlines over global energy tensions on the geopolitical front very soon.
We have a heavy economic data week ahead featuring the CPI print on Tuesday - all eyes on this print to give us evidence on the next move for capital rotation in the markets.
Cheers, have a great week my friends.
- Cupid of Wall St.
📰 Fox MetaCapital’s Weekly News Recap
You may press the 🗞 to read more about each headline.
Major News + Crypto Headlines
🗞 Heavy Week of Economic Data
💭 Matthew’s Bullet Thoughts
All eyes on Tuesday’s CPI data which will allow investors to hedge their bets on the tone and direction of monetary policy moves from the next FOMC March 22nd.
The U.S Dollar and Treasury Yields moved higher in February signalling fear of prolonged rate hikes coupled with weaker than expected earnings from top U.S companies.
Should CPI data print hot (higher than expected) it would significantly reduce the appetite for risk assets (crypto & stocks) in the short term and we could see continued downside in the price action and market cap of these indices.
I speculate that the data will print under estimates (better than feared) as my chart analysis (see technical analysis section below) have been showing a need for a pullback across the board following a very bullish January and start to 23’
We also wish to see as expected or marginally higher than expected earnings from S&P500 reporting companies this week to avoid any further selling in the equity markets.
It’s worth noting as well that Jobless claims data has become centre stage for investors as the FED is heavily relying on a contraction in the labour market to provide evidence of a cooling economy - we wish to see jobless claims on the rise Thursday.

🗞 FED Chair Jerome Powell says he "expects 2023 to be a year of significant decline in inflation.
💭 Matthew’s Thoughts…
I wouldn’t anticipate the Chairman of the FED to ‘expect’ anything that he wasn’t confident of achieving. A reduction of costs in the economy requires a contraction in the labor force (with the number of layoffs making headlines we are certainly on our way) and a reduction of CPI / Core CPI prints in consecutive quarters - pending.
If these are his public remarks I intuitively believe that 2023’ will polish the final touches on the aggressive quantitative tightening policies that have wrecked the markets over the past 18 months.
This adds confluence that the market is within bottoming formation now and that only 1 of 2 possible outcomes remain:
Smart Money Front-Running Retail Fear: The market has already bottomed and in an uptrend with each pullback in prices becoming an opportunity for dollar cost averaging.
The Biggest Bulltrap in History: There is one last mega shock to the markets creating a capitulation event unlike. any other off the backs of exit liquidity being provided from retail traders overly eager to return to the market early.

🗞 64% of North Americans living Paycheck to Paycheck
💭 Matthew’s Thoughts…
This is a significant financial concern for many individuals and households in North America. A large portion of the population is struggling to make ends meet and is relying on their full paycheques to cover living expenses due to rising costs of living, stagnant wage growth, and record consumer credit card debt - certainly all signs of a cooling economy wouldn’t you agree?
From a financial markets standpoint we would expect companies that rely heavily on consumer spending to begin showing decreases in earnings and commence layoffs to strengthen their bottom lines - and we are seeing this with the tech sector especially.
Additionally, if paycheques are being fully deployed to living expenses it would mean there remains little to no savings being accumulated which we can verify as truth given the chart below.

With little savings being accumulated, the far majority of citizens are at a financial hard rock to either capitulate investments or accrue none at all.
Which indicates to me this is a prime position for institutional funds to begin purchasing and driving up prices given the discount across assets across the board.
It’s a heart wrenching headline for our personal lives, but a strong leading indicator that the worst may be behind us.
🗞 SEC vs. Kraken: Staking Settlement
💭 Matthew’s Thoughts…
Shifting from the macro environment into crypto, this headline offered a punch-to-the-jaw last week to crypto market participants as we brace for a wave of predatory action against crypto companies and exchanges in the coming weeks.

The SEC charged (and settled) crypto exchange Kraken over their non-disclosure statements and failure to register with the SEC over their staking program.
Staking is the process of holding or locking up a certain amount of cryptocurrency in a wallet for a certain period of time in order to support the network and earn rewards - no different than when your bank offers you 0.00000000001% interest on the cash you lock up in their piggy banks.
For context on where the yield comes from that exchanges provide; staking is often required for certain proof-of-stake (PoS) blockchain networks, where users are incentivized to participate in network validation and maintain network security. In essence staking aids decentralization.
By using a crypto staking service, individuals and organizations can earn rewards from staking without having to manage their own staking infrastructure. The service provider typically handles all technical aspects of the staking process, including setting up the wallet, configuring the network, and monitoring network performance.
Crypto staking as a service can offer several benefits, including simplified setup and management, reduced costs, and increased security. This can be particularly useful for individuals or organizations who may not have the technical expertise or resources to run their own staking infrastructure.
So why did the SEC sue Kraken? Because the SEC is the bully bodyguard of Wall St. banks.
You see, crypto staking services can offer increased liquidity and access to a broader range of staking opportunities, allowing users to earn rewards from a variety of different blockchain networks.
Why hold your money in a bank offering $0.01 per year when you can withdraw that liquidity and earn 20% by staking.
🗞 Brad Garlinghouse offers up his ‘2 cents’ with a Million Dollar thread.
💭 Matthew’s Thoughts…
The CEO of Ripple (think $XRP) fired back with his own commentary on the event and offered an incredible top-down perspective on where blockchain and crypto adoption is worldwide to remove the narrow focus on U.S legislation and regulation.
In short, the World is bullish on Crypto, the U.S is grumpy their privilege of printing U.S Dollars to live lavishly is coming to and end.

🗞 U.S Banking Giant “We love crypto.”
💭 Matthew’s Thoughts…
Futhermore, this statement from BNY Mellon adds confidence to my speculation that all of the FUD and grumpy regulation is merely a scare tactic allowing more time for wholesale buyers of these data networks to accumulate generational positions in the future of the digital economy.
Crypto is here to stay, stay the course.
🗞 The architect of the XRP ledger David Schwartz insinuating “XRP is a commodity, not a security.”
💭 Matthew’s Thoughts…
A brilliant thread was published by the CTO of Ripple, David Schwartz earlier this week helping differentiate crypto commodities from regulated securities by comparing the rights you receive with a Stock or share, relative to the utility of a cryptocurrency.
“If it gives you rights, its a security. If it gives you abilities, its a commodity”


Fox MetaCapital’s Weekly Asset Review + Technical Analysis
📈📉 The Week Ahead in Charts
Symbols 📈 or 🐂 = Bullish / Positive | 📉 or 🧸 = Bearish or Negative | ⚖️ Ranging or Low Volatility
FOREX
📉 DXY(U.S Dollar) + 📈CAD
💬 Matthew’s Commentary, Analysis & Prediction for the Week Ahead:
My outlook for the U.S. Dollar Index (DXY) remains bearish, despite the recent surge that was triggered by the bullish Jobs report released in late January.
Although I did not expect a retest of the yearly open so soon into the quarter, it is possible that we may see a break of the 104 level this week.
I still anticipate that the DXY will decline further into the low 100s to high 99s before the March Federal Open Market Committee (FOMC) meeting which will give risk room to run in the short term.
My analysis shows a sweep of the range high, deviation to the range lows forming a swing pattern failure and a return to the range highs on or around March 22nd.
Featured Chart DXY 1D (click to enlarge photo)

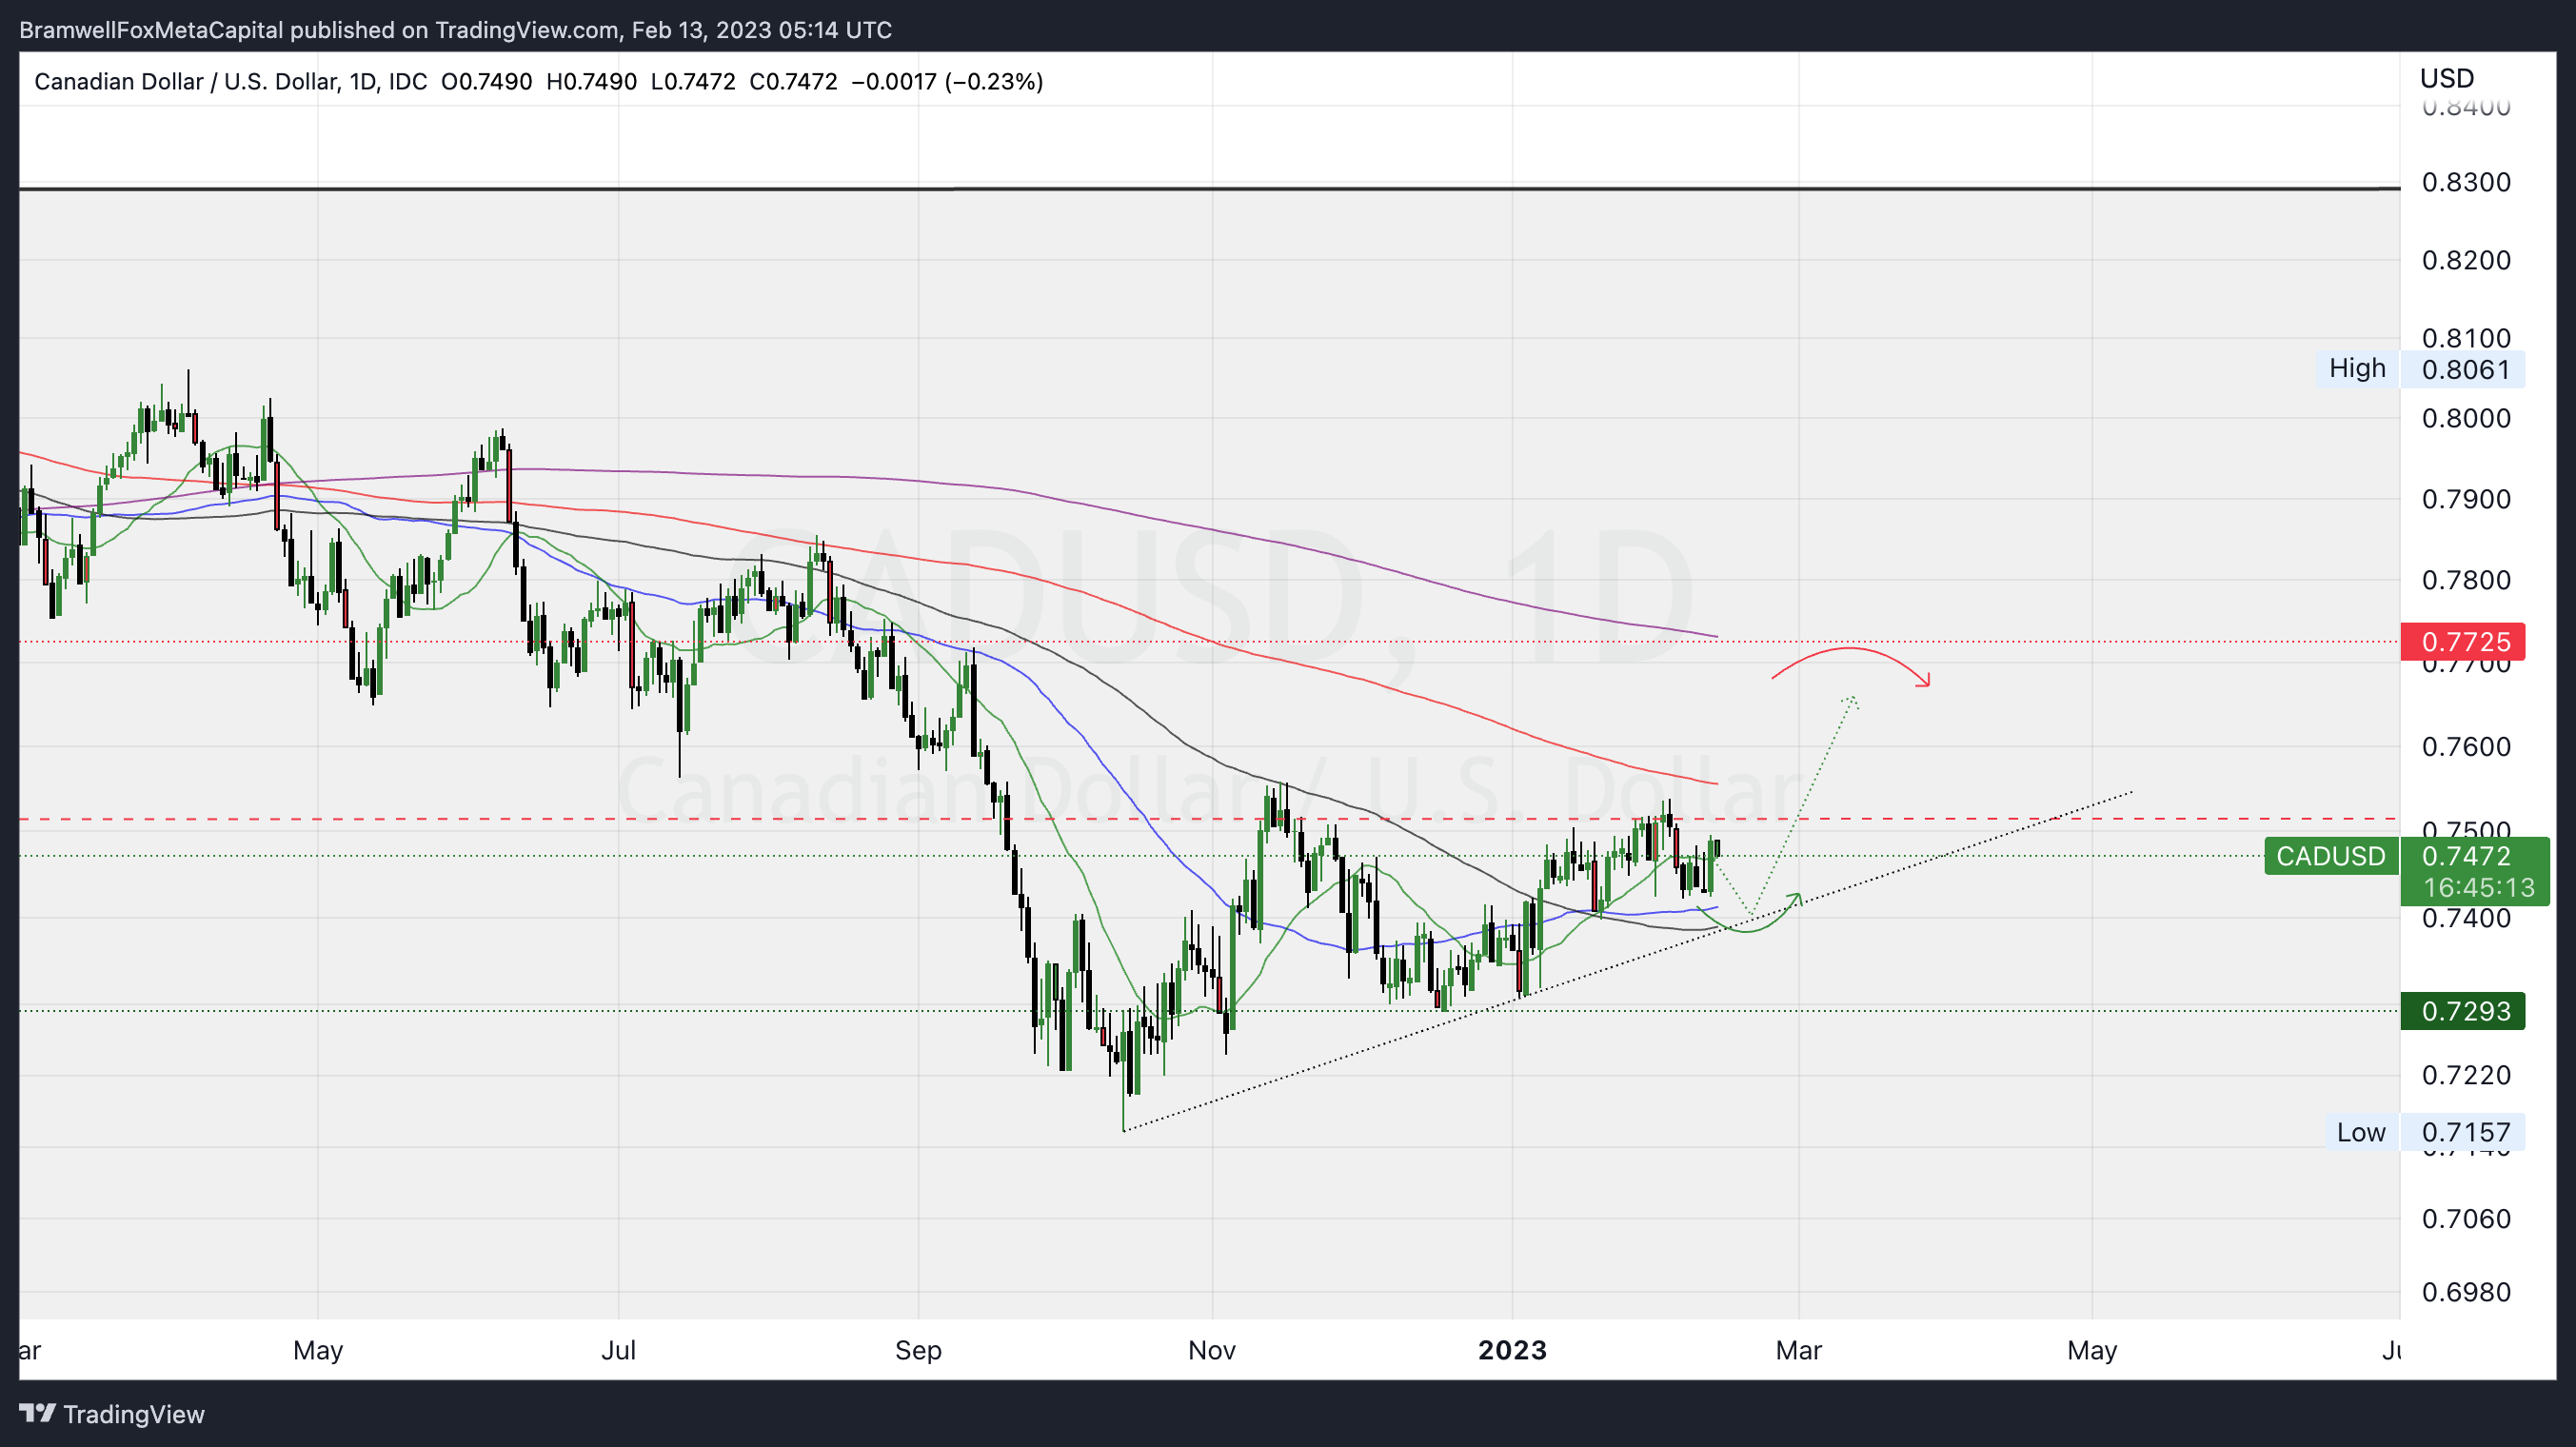
The Canadian Dollar isn’t nearly as exciting or volatile - yet holding ground on its uptrend to the higher timeframe median line (red dotted line).
While I’m expecting the DXY to lead the FOREX market for currencies, I do believe the CAD bullish trend will remain intact and my targets for .7725 have not changed.
Featured Chart CAD 1D (click to enlarge photo)
Equities
📉 S&P500 + 📈 TSX + 📉 VIX
💬 Matthew’s Commentary, Analysis & Prediction for the Week Ahead:
In the short term, the direction of the S&P 500 index will be influenced by both earnings reports and Treasury bonds.
I anticipate a retest of the bear market resistance around 3950, which could be triggered by either weaker-than-expected earnings reports this week or a higher-than-anticipated Consumer Price Index (CPI) print.
However, I am inclined to believe that the latter scenario is more likely, as I expect costs (inflation) to decline across the board. This means that any sell-offs in the stock market will be driven by layoffs and missed earnings reports.
Featured Chart S&P500 1D (click to enlarge photo)

Given that the TSX isn’t as tech-heavy as its U.S counterpart index, I do forecast the TSX to continue it’s uptrend late into the quarter with minimal volatility.
Featured Chart TSX 1D (click to enlarge photo)

The VIX is our indicator of S&P volatility and surprised me last week with a breakout of the diagonal resistance.
I was expecting a further drop into the 16.25 support but the VIX retested the range high with a daily SFP forming highlighted by the yellow circle below.
This typically indicates a stronger move to the opposite side which could be bullish for the markets towards the end of week, possibly indicating that economic data prints positive for risk.
Featured Chart VIX 1D (click to enlarge photo)

Treasuries
📉 US2YR & 📉 US10YR
💬 Matthew’s Commentary, Analysis & Prediction for the Week Ahead:
The first chart is from last weeks edition where I believed that the US 2-Year would close the gap it formed and continue down its formation.
Featured Chart US2YR (Flashback to Last Week) 1D (click to enlarge photo)

Rather, we experienced a U.S debt sell-off with the 2-Year nearly reaching range high yields 4.6%.
I’m expecting this range high to be tested this week and expect a reversal to close the cap and deviate back down to the dotted red median ~4.25%.
Featured Chart US2YR 1D (click to enlarge photo)

The 10-Year Treasury bond is attempting to establish a bullish trend by breaking out of the green Ichimoku cloud, which could further increase the rise in yields.
However, I anticipate that 3.8% will act as a resistance level and cause the 10-Year Treasury bond to deviate from its path towards the median dotted line around 3.4%.
I believe that the recent increase in yields is a result of hedging positions being taken in anticipation of this week's Consumer Price Index (CPI) print, due to concerns about the Federal Reserve's "higher-for-longer" monetary policy stance.
Therefore, a lower-than-expected CPI print on Tuesday will be crucial in shaping the direction of the bond market.
Featured Chart US10YR 1D (click to enlarge photo)

Cryptocurrencies
📈 Bitcoin + 📈 XRP & 📉 XRP.BTC + 📉 Total Crypto Market Cap
💬 Matthew’s Commentary, Analysis & Prediction for the Week Ahead:'
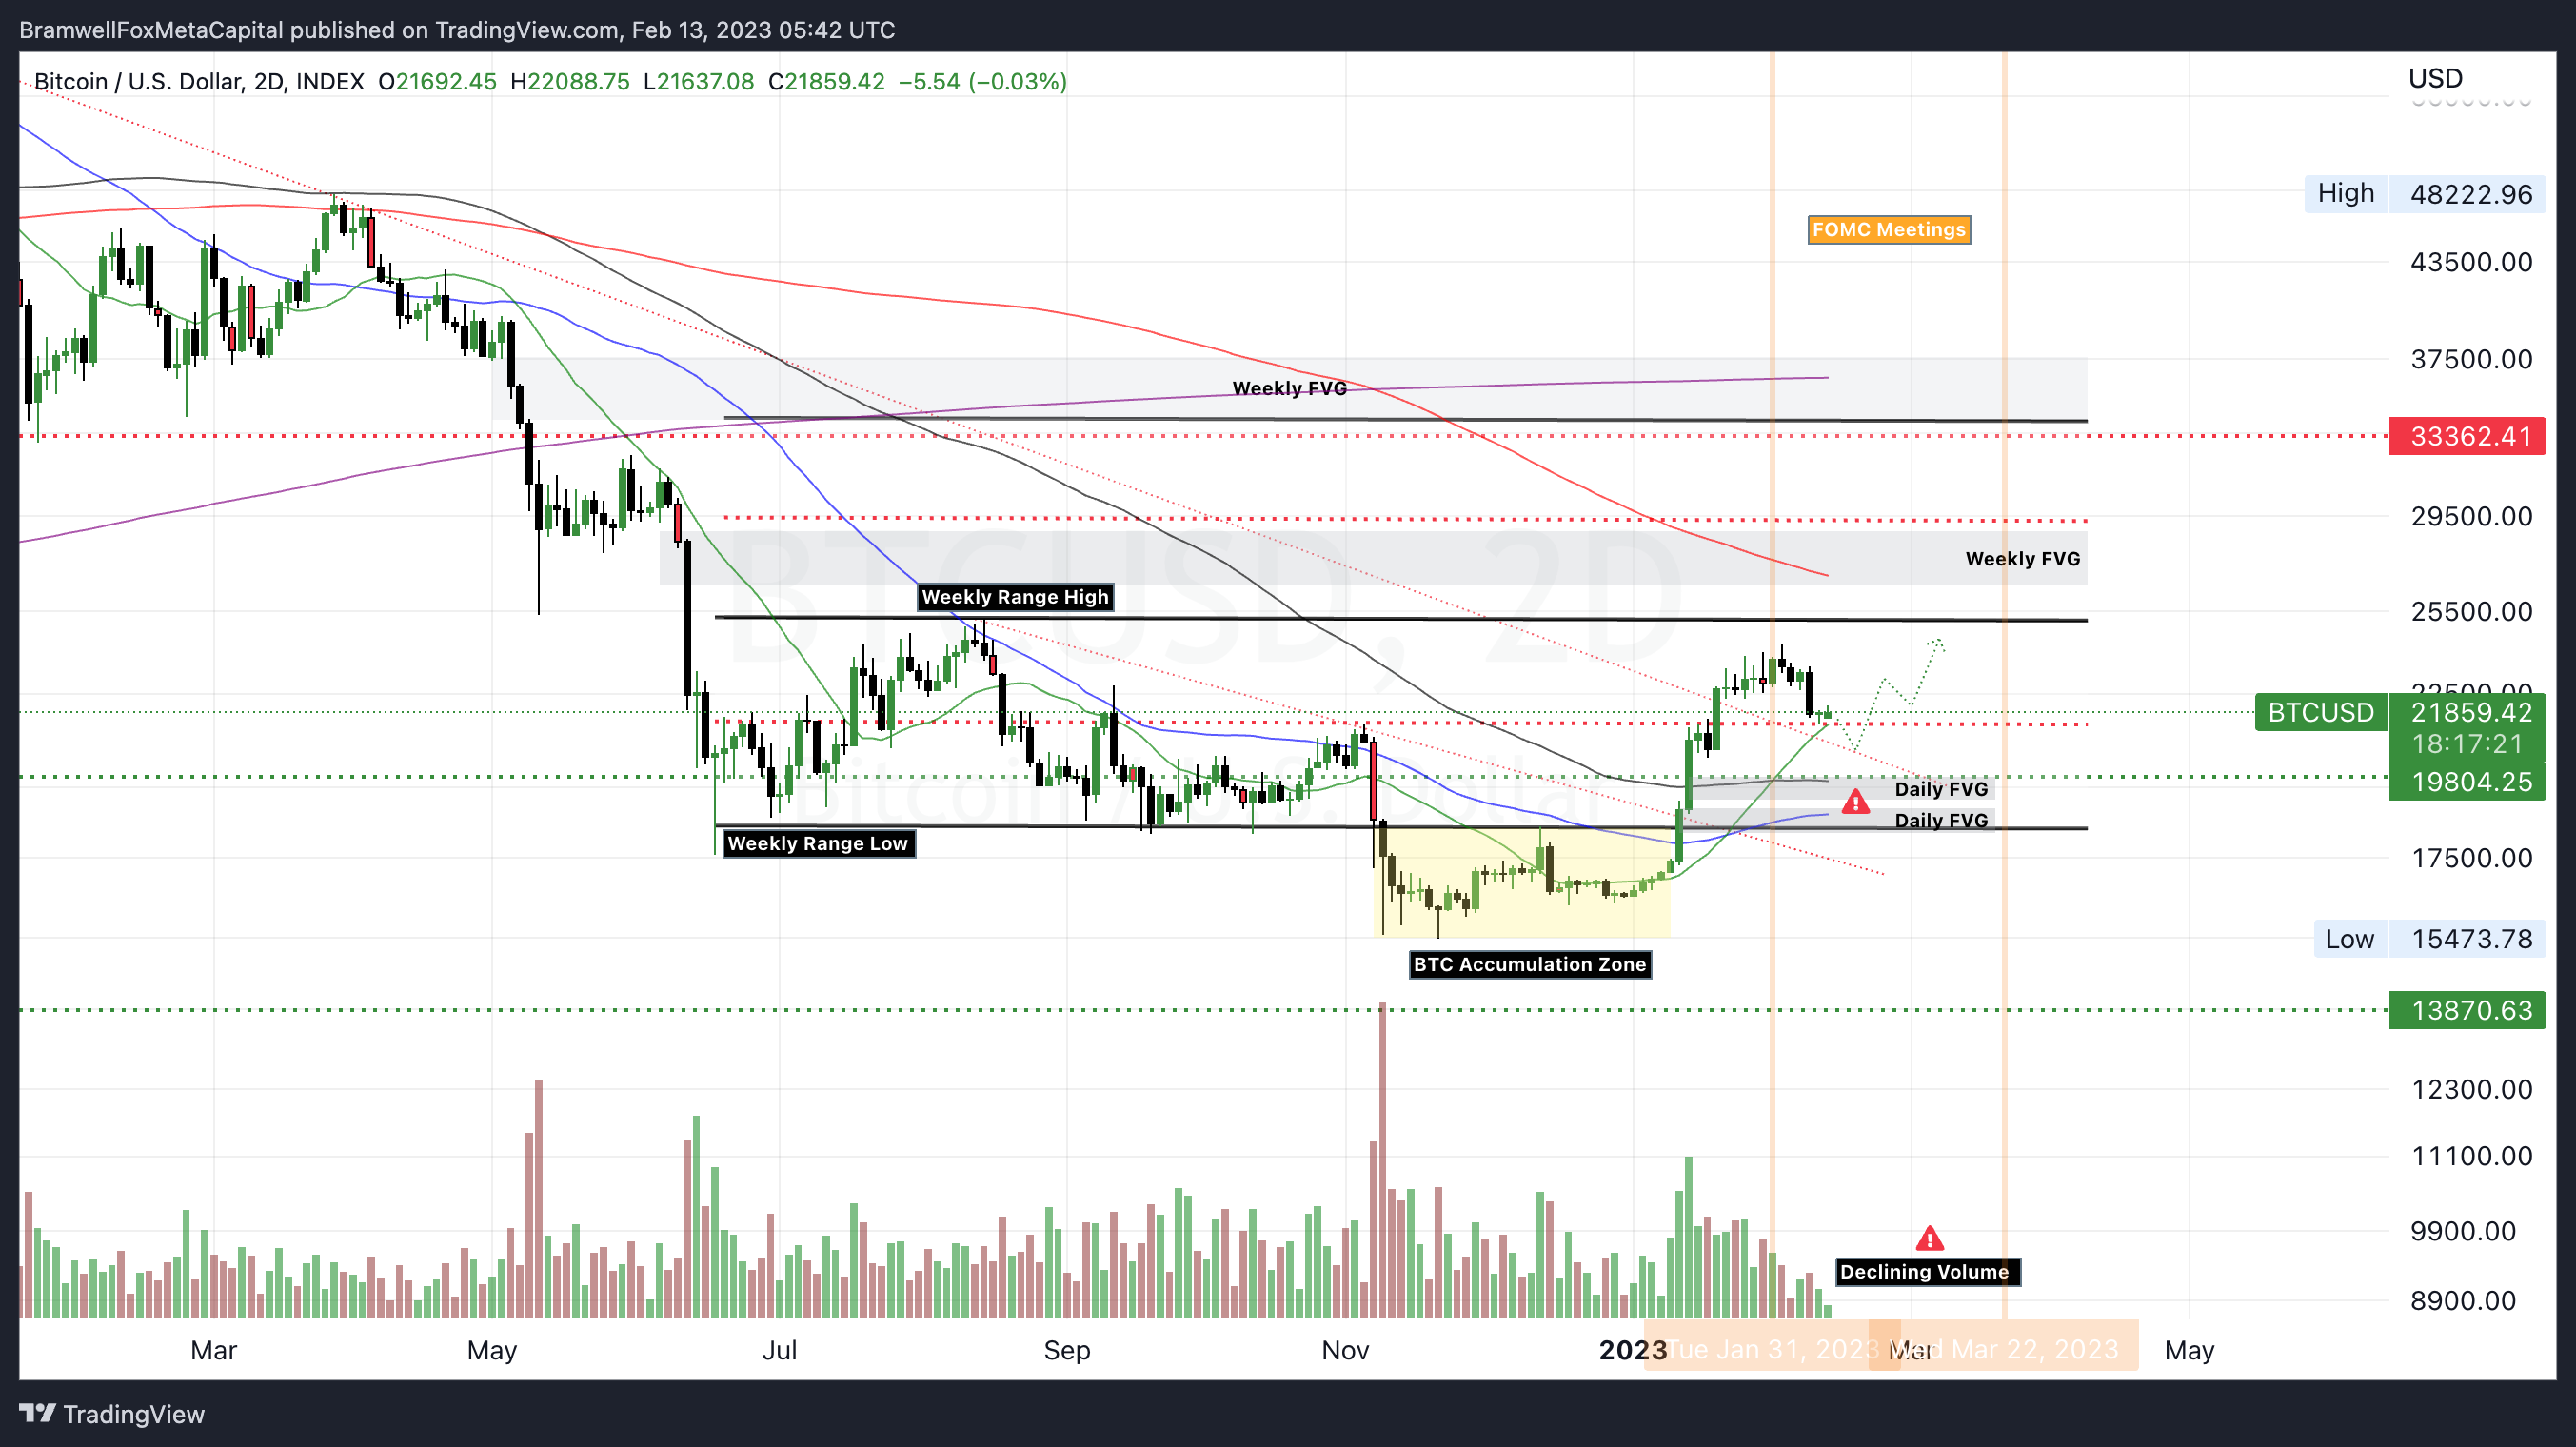
During the recent surge, both Bitcoin and many other assets, including XRP, produced fair value gaps in their technicals that are typically filled by future price movements.
As of now, Bitcoin is trading just below 22,000 and testing its daily 20-day moving average (represented by the green line), which coincides with the median weekly range.
My initial downside targets are 20,300 to 20,500, with a second target forming a potential low point to clear the daily fair value gap around 19,500 to 19,800 before potentially continuing upward.
Featured Chart BTC 2D (click to enlarge photo)
Last week I drew this chart highlighting the daily FVG for XRP ~ $0.365 cents…
Featured Chart XRP (Flashback to Last Week) (click to enlarge photo)

Well, we have just cleared the weekly range lows and filled the gap, which means XRP now has the potential to move back up within the range.
From a technical standpoint, this presents an excellent opportunity to buy, but we are still waiting for macroeconomic confirmation.
It's important to keep in mind that the XRP lawsuit is set to conclude in late March. If you are considering dollar-cost averaging at these lows, this is a crucial factor to keep in mind.
Featured Chart XRP 1D (click to enlarge photo)

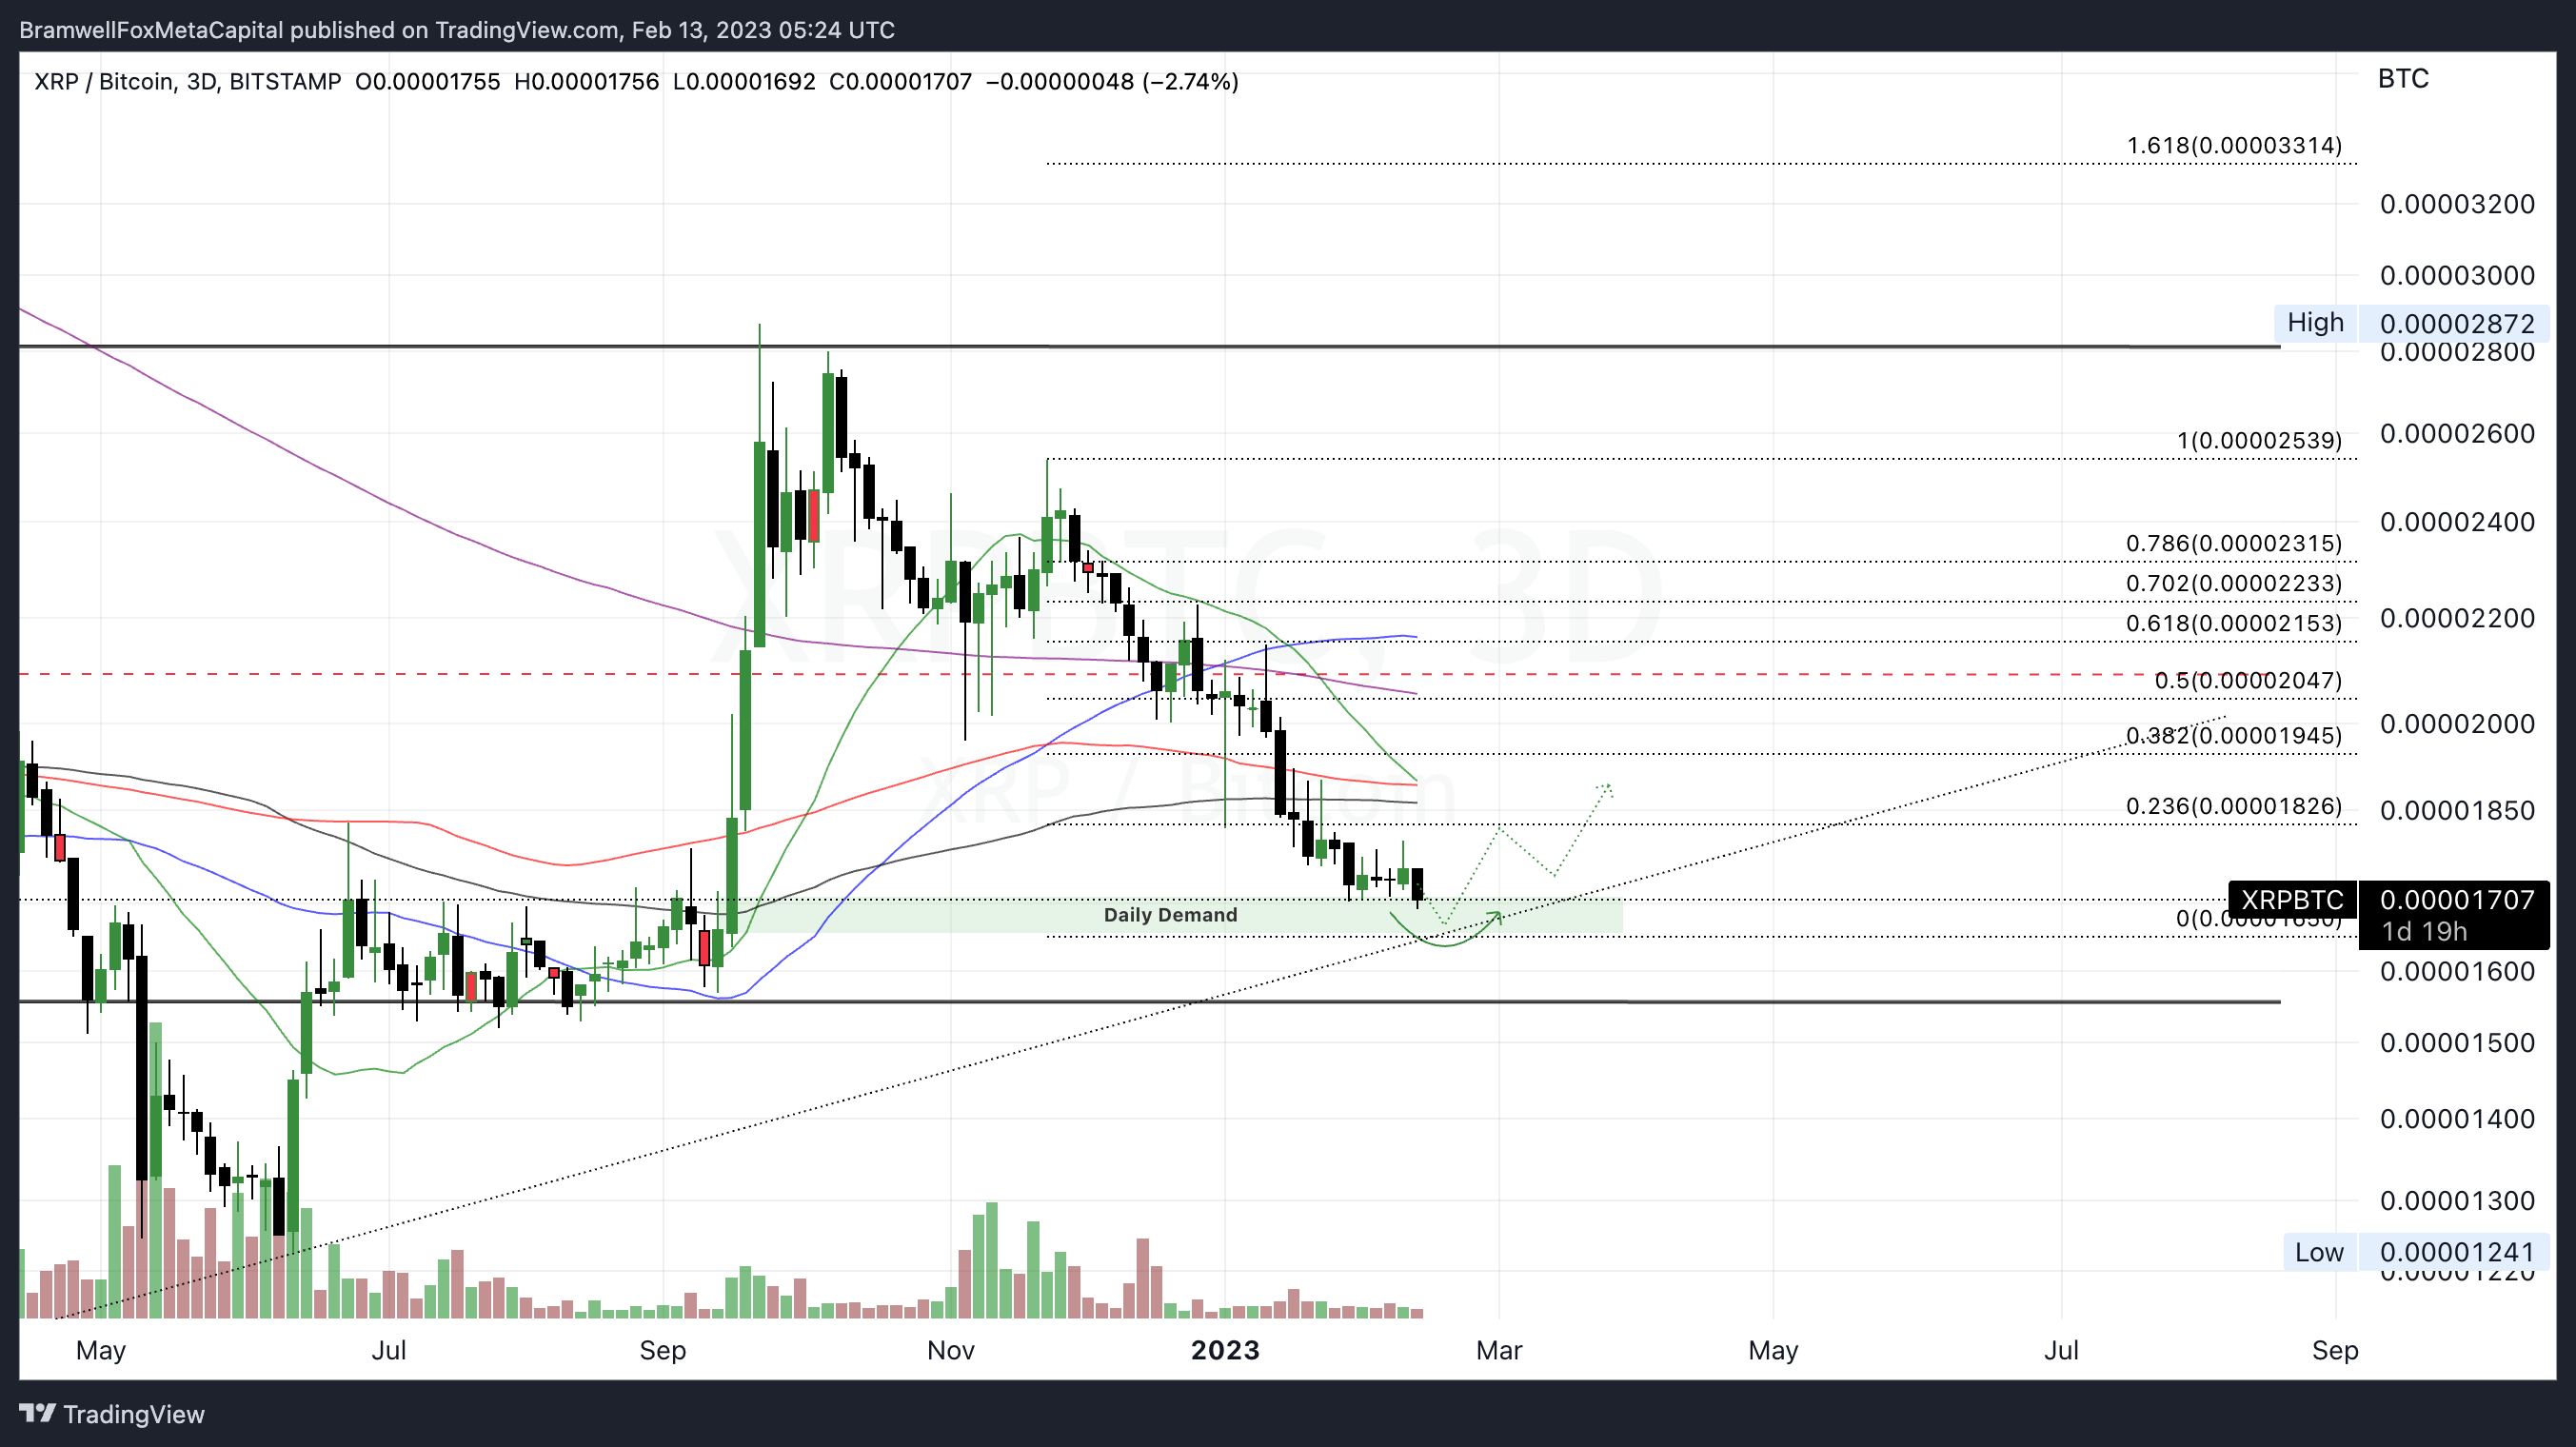
I was expecting the XRP price to dip due to it’s XRP/BTC pairing.
Now that we have taken these lows and tested the trend line I believe XRP is primed for another rally.
Featured Chart XRP.BTC 3D (click to enlarge photo)
When examining the overall cryptocurrency market capitalization, it appears there is more potential for a decrease compared to what the charts of BTC and XRP indicate.
I speculate that, with additional action from the SEC, some assets may see a further decrease in market capitalization as investors shift their investments away in response to enforcement actions.
The potential downside target is the range low of $900 billion.
Featured Chart TOTAL 1D (click to enlarge photo)

Commodities
⚖️ Oil + 📉 Gold & 📉 Silver
💬 Matthew’s Commentary, Analysis & Prediction for the Week Ahead:
In the upcoming weeks, oil is likely to encounter resistance from its moving averages and downward sloping resistance lines. I anticipate oil to display balanced volatility ranging from $75 to $81 until further macroeconomic developments provide us with a clearer understanding of the supply and demand dynamics of the global economy as we progress through 2023.
Featured Chart Oil 1D (click to enlarge photo)

Like Bitcoin, Gold experienced a multi-month rally to its high’s of $1950 per oz. I’m expecting a pullback and consolidation just above the $1.785K region pending confirmation of interest rate decisions and strength of the U.S Dollar as well as economic data prints.
Remember, Gold is typically an inflation hedge asset meaning when currencies show weakness, investors return capital into traditional forms of hard money.
Downside targets $1.785K.
Featured Chart Gold 1D (click to enlarge photo)

Silver is in the process of reclaiming its range lows and very close to a breakout.
Upside targets $25-$26 and not expecting any meaningful downside action in the short term.
Featured Chart Silver 1D (click to enlarge photo)

👋🏼 Hey!
Thanks for reading this week's Weekly Market Update Edition No. 030
If you have any comments, feedback or questions on any material written in this edition please share as I'd love to continue a dialogue below.
If you enjoyed the read, I’d really appreciate if you’d share our community with your network of friends, family & fellow investors!