


🗞 Weekly Market Newsletter | Edition No. 03
News Update + A Full Analysis of Major Indices Including Stocks, Crypto, Commodities, Bonds & Forex

Hello Everyone,
We have a big week ahead for the markets and I couldn’t wait to get behind the charts today and put together a macro analysis for you featuring some of the top indices that I use to gather weighted evidence for a bullish or bearish take, let’s dive in.
- Bramwell
Technical Analysis
📉 DXY & US 10YR
We’ll begin highlighting a 1W timeframe of the DXY (U.S Dollar Index) as I want to explain why I believe the Dollar has completed (or near completed) a high timeframe 5th Wave and should begin a major correction ending in 2024.
Featured Chart DXY 1W Timeframe, 15-Year Cycle

The DXY collapsed in 2008, marking an all-time low of 70.798. After a series of quantitative easing measures (government signed federal reserve bailouts) the markets quickly reacted with an impulsive 1st wave tapping resistance at the 88.235 region marked in green.
In 2015 we broke this resistance impulsing up for it’s wave 3 tapping the 103.20 region in January of 2017 before a running flat multi-year correction which included the COVID crash of 2020 highlighted by the green vertical line (notably the beginning of #Bitcoins major bull-run to 69K).
After a double bottom correction re-tested the demand zone in green (~88) the DXY began its 5th wave impulse reacting to the news of projected interest rate hikes announced by the Federal Reserve to combat soaring inflation.
The DXY reached a 20-year high on July 14th peaking at 109.29 as it reached the supply zone marked in red and only two scenarios are possible at this important range.
🐂 Bullish Scenario: The 14-year cycle has completed for the DXY and a multi-year correction is about to take place dropping the dollar below the 100 by 2024 - a very important year for the U.S economy with Presidential Elections taking place.
🐻 Bearish Scenario: The 5th wave of the cycle has not yet completed and the Dollar breaks through this resistance en route to a new high marked by the 120 horizontal line.
Let’s zoom in closer before I give you my thoughts on the week ahead..

Featured Chart DXY 1D Timeframe, 2-Year Scope
We can clearly see that April 2021 marked bottom for the DXY following the global economic shutdown. With inflation soaring the Federal Reserve had to introduce quantitative tightening to combat rising prices amidst soaring inflation and a record level balance sheet.
We can apply a Fibonacci retracement tool from the local bottom (04/21’) to the peak (07/22’) which will highlight for us likely correction zones for the dollar.
Bramwell’s Prediction for the Week Ahead: The equity markets have been in free fall and investor sentiment is extremely fearful. A strong DXY typically would mean a strong U.S economy however with the June CPI data release showcasing inflation at a 40-year high, we know that the DXY isn’t soaring due to a robust economy.
Rather, the DXY is / was soaring due to both extreme economic weakness in Europe & Asia + rising 2YR & 10YR yields on US government Bonds (see below)
Featured Chart US10YR 1D Timeframe

Additionally, a super strong DXY is not good for global economic prosperity & peace as struggling nations lose purchasing power on imports settled in USD further adding fire to a tension filled geopolitical landscape.
It’s because of big picture point of view that I believe the charts may be showing a foreshadow of future dovish announcements from the Federal Reserve to pause / decrease the rate of interest rate hikes moving forward putting a pause to combating inflation for a continued economic contraction and opening up breathing room for economic growth (expansion) to occur.
I’ll add evidence shortly using my analysis of Crude Oil, Gold & US Equity Indices to forecast my perspective that the DXY chart is about to begin a short term correction down to the 100 mark (1-3 month) and potentially a long term (18-24 month) correction re-testing the .618 fib line at ~96.39
Bramwell’s Prediction for the Week Ahead: I’m bearish on the DXY in the immediate short term and expect for the week ahead to see the Dollar begin a correction to the 103.5 - 104.75 region.
📉 THE VIX
The VIX stands for Volatility Index.
I like to think of the VIX as a high-timeframe-risk-oscillator which measures the level of risk, fear, or stress in the market - typically inversely correlated with market price action.
Below I present to you a combo chart featuring the VIX, DXY & Total Crypto Market Cap and its price action beginning in early 2020.
Featured Chart VIX 1W Timeframe

As you can see, when the VIX declines in strength or the DXY declines in strength (marked by the green vertical lines respectively) risk-on assets such as Cryptocurrencies appreciate in value. The same theory can be applied should I have added the S&P 500 to this chart to showcase a similar up-trending environment.
To contrast, when the VIX or DXY increases in strength, market participants de-risk and favor interest bearing assets such as short term bonds or money market instruments and the value of Cryptocurrencies and Stocks decline.
Bramwell’s Prediction for the Week Ahead: The VIX is sitting on a weekly trendline simultaneously as the DXY printed a bearish engulfing candle. I predict that the VIX breaks the trendline this week falling into the green support region (~20.00) giving room for growth assets to appreciate for the following 6-8 weeks.
📈 Dow Jones Utility & Industrial Average
I consider the Dow Jones Indices (Utility - Transportation - Industrials) to be the heart of the US Economy.
To turn on any manufacturing factory, corporations require utility companies to power their operations. Once products are manufactured, logistics firms must transport to inventory locations or retail stores. Once on shelf, end consumers may purchase goods completing the full cycle. Therefore, we can use the Dow Jones Utility Average as a leading indicator of growth in the economy.
Featured Chart DJUA 1D Timeframe

In the chart above I have plotted a rising parallel channel to which the Utility Index has been moving since the crash in March 2020.
We can see that the DJUA reached a top around the same time that the DXY began gaining strength in April 2021 due to rising interest rates.
💡You may be curious on why the DJUA would begin to decline on this news - it’s because higher interest rates equates to rising financing costs to which utility firms primarily operate. Higher financing costs decrease their respective bottom lines and investors sell off to rotate capital into better performing instruments.
We can see that the DJUA had an impulsive reaction off the bottom of the channel and slightly corrected once it met the midline of the higher timeframe channel (red dotted line) forming a falling wedge (bullish pattern) followed by a breakout last week to end the week.
A very similar breakout occurred on the Dow Jones Industrial Average below which gives further confirmation as leading indicators that market sentiment is flipping bullish.
Featured Chart DJIA 3D Timeframe
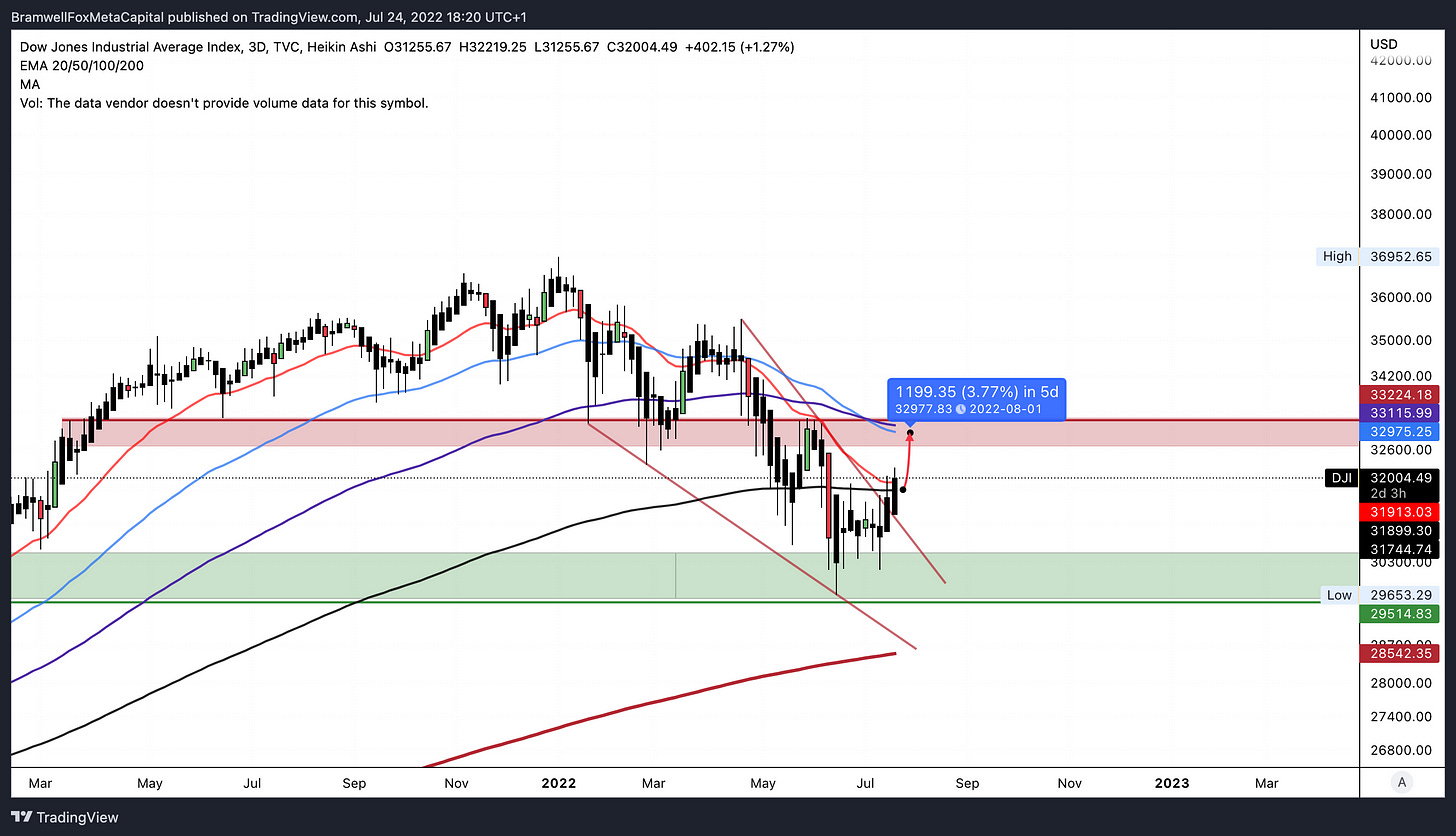
Bramwell’s Prediction for the Week Ahead: I’m bullish on the heart of the economic indices to which I've marked forecasted targets for the DJUA & DJIA to rise ~3.75 this week before reaching local resistances highlighted by the red zones within the next 1-2 weeks.
📈 S&P 500
With a bearish take on the DXY, 10YR & VIX this week you can likely deduce that I expect equities to rally - and you’re right.
I’ve charted the S&P 500 reaching my first targeted region of weekly demand and a further zoomed in chart following below.
Featured Chart S&P 500 Futures 3D Timeframe

Featured Chart S&P 500 Futures 1D Timeframe

I’ve included the indicators on the 3D price action to highlight a bullish RSI with a recent breakout above its moving average, a MACD bullish crossover, rising positive DMI and a potential breakout about to occur on the On-Balance Volume.
Zooming into the 1D chart we can see a horizontal parallel channel breakout within a rising wedge.
Bramwell’s Week Ahead Prediction: I’m bullish on the S&P for the next 1-2 weeks as i’ve set a forecasted price target of 4000-4125 or a ~5% increase before a possible correction occurs to re-test the weekly demand region and potentially forming an inverse head & shoulders as midterm elections arrive in November.
📉 Crude Oil
Will we get further breaks at the pump? ⛽️
I think so.
Oil has been steadily declining since its peak in March at ~$130 per barrel and has reached the bottom of its trading channel showing weakness alongside a sliding dollar and other commodities such as Copper, Corn & Lumber.
Featured Chart Crude Oil 1D Timeframe

Bramwell’s Week Ahead Prediction: This prediction is a tricky one as many geopolitical factors become ingredients into the price action of Oil. The price action was primarily driven by the Russian v. Ukraine War which continues into the second half of 2022 with no resolution in sight.
Based on pure technicals paired with a little intuition, I'm going to predict that Oil breaks down below the channel and re-tests the Weekly Demand under $90 per barrel within 1-2 weeks from today.
📈 Gold
I’m so bullish on Gold it hurts.
Gold has been printing corrective higher lows since it’s high of $2075/oz in early 2020. Gold has been re-testing a powerful region of demand (green region) as this is the first official re-test of the 2012 highs following the decade-long breakout.

Bramwell’s Prediction for the Week Ahead: I’m extremely bullish on Gold highlighted by the many oversold indicators i’ve added (yellow eclipse) across the board. I’m also bullish given the weak technicals and narrative surrounding the DXY, Bonds + Commodities - it all adds up to an inflationary environment about to occur, we’re just awaiting the official news.
I’m targeting a price rise of $150, or ~8.25% to $1850 per oz by September.
*Note - this idea will be invalidated should gold drop below $1676.91 as that would print a lower low on a high time frame - not good for the price of shiny things.
📈 Bitcoin
I’ve saved the best for last, and Bitcoin has a huge week ahead.
Bitcoin is up against a declining diagonal resistance (red) however printed strong momentum last week with a bullish weekly close on the horizon.

A break of this resistance may be fuelled by the many bullish indicator setups below: RSI moving average breakout, oversold Money Flow & Stochastic breaking back into channel, bullish MACD crossover, Accelerator Oscillator crossover and a bullish rise in On-Balance Volume.
Bramwell’s Prediction for the Week Ahead: I’m sticking to my growth expectation for risk-on assets and targeting a breakout of BTC to meet the red region of demand at $28.5K within 21 days. It’s an aggressive prediction that could easily be invalidated with a whipsaw breakout this week, but I'm taking the bull by its horns on this one.
Did you enjoy this newsletter? Share it with your network, friends & family!