


🗞 Weekly Market Newsletter | Edition No. 29
News Update + A Full Analysis of Major Indices Including Stocks, Crypto, Commodities, Bonds & Forex


Sunday, February 5th, 2023
Hello Friends,
I want to start off this episode by welcoming all of our new subscribers to Fox MetaCapital - it’s a pleasure to have you all a part of our community and I’m truly grateful for the opportunity to share my perspectives on the global economy and financial markets each week with you - 🙏🏼
This past week saw a flurry of financial news events, starting with the Federal Open Market Committee (FOMC) meeting in the middle of the week and ending with the Jobs report at the end of the week. Meanwhile, Chinese spy balloons had the time of their lives into the weekend until their party was cut short.
It wasn't just the balloons that lost air; the cost of goods in the US and Canada are also finally disinflating as well. After two years of skyrocketing prices, it looks like we may no longer have to make it rain to afford scrambled eggs.
Scrambled is actually a good word to kickstart this episode as mixed signals in the global economy are sending confusing signs to investors.
Questions being asked are;
Are we still fearing a recession? Or nah.
How long can Central Banks afford to keep interest rates so high?
Why is the U.S Debt Ceiling officially on the moon?
Why are we buying everything on bad news and selling everything on good news?
What are the Spy Balloons distracting us from?
These are some of the headlines that made news this week and I’m going to jump into them and share my thoughts with you and predictions on what will unfold throughout the rest of 2023’.
Further down below you’ll see my technical analysis and commentary on all of the major indices and tl;dr it looks bullish for risk assets.
Enjoy the edition and let’s dive in.
- Bramwell
*ps. Course Episode Four of ‘A Journey From Barter to Bits’ - Learning the Basics of Fundamental Analysis will be published this week for subscribers!
📰 Fox MetaCapital’s Weekly News Recap
You may press the 🗞 to read more about each headline.
Major News + Crypto Headlines
🗞 Disinflation has arrived; but more time will be needed.
💭 Matthew’s Thoughts…
The most anticipated economic event of the year set the bulls free on Wednesday.
Despite the Federal Reserve raising interest rates by 25 basis points, investors ignored the effects of the hike as they only heard Chairman J. Powell acknowledge that disinflation has finally arrived.
The dollar faced a sharp decline mid-week as investors' appetite returned to risk assets across the board.
The S&P 500 broke its bear market trend, and Bitcoin reached highs of over $24,000.
It was a welcome return of greed (rather than fear) to the markets.
While the bulls are not out of the woods yet, the current economic environment favors continued growth for risk assets through the end of the first quarter, when the Fed reconvenes to discuss its next move.
All eyes will be on subsequent economic data reports, including consumer savings, unemployment, wage growth, GDP, and CPI.

🗞 The U.S Interest Payments on Debt May Exceed $1T - how long can this continue?
💭 Matthew’s Thoughts…
Imagine how many tax-paying citizens it would take to write a $1,000,000,000,000 check - a lot.
Now imagine taking that $1,000,000,000,000 check and setting it on fire because the government might as well, given the fact that their $31 trillion debt ceiling means that a mere $1 trillion will only cover the annual interest expense.
If voters were asked on the ballot box what was most important to them:
a) healthcare
b) infrastructure
c) military defense
d) paying down the government's unlimited credit card interest
…which would they pick?
It sounds absurd, but it's the truth.
Our income taxes are being funnelled to this very cause globally because of a broken financial system.
We need a solution, and that solution may be central bank digital currencies.
To find out why, you'll have to read my Twitter thread.

🗞 Market Analysts Expected 187,000 Jobs Added, It Got 517,000 🤯
💭 Matthew’s Thoughts…
Months ago, I began telling a strange tale.
I wrote a story to my community about how crude it feels as an investor to hope and pray for fellow citizens to lose their jobs for the sake of a green portfolio.
That’s right, we were conditioned to hope for higher unemployment, layoffs and bad news about the economy.


Why? Because central bankers told us so.
They said that until unemployment rises, there would be endless interest rate increases and they began hiking.
They watched as consumer credit card debt accumulated and supply chains shortened, causing the cost of goods to skyrocket.
They also saw retirement funds and investment savings plummet 60-80%. Despite this, they hiked interest rates even more.
This is the current situation, where central banks have essentially taken control of the markets.
We now buy stocks based on headlines of a struggling economy and sell them when the economy shows growth.
It's completely backward
🗞 Go Home Global Economy, You’re Drunk.
💭 Matthew’s Thoughts…
Take a look at this👇🏼

That’s exactly what I was just talking about ☝🏽
Mixed signals…or broken system?
You decide.
🗞 I need a Dollar, Dollar, Dollar is what I need.
💭 Matthew’s Thoughts…
🎵 And if I share with you my Dollar, will you share your story with me?
Not only is U.S. credit card debt at all-time highs, but average consumer savings are now reaching all-time lows, while the cost of servicing that debt is 20% per year.
Many homeowners have defaulted to relying on their home line of credit, essentially borrowing against the value of their homes to service short-term debt.
However, a sudden downturn in the housing market could cause problems. Some people have had to take on two or three jobs or side hustles to pay their bills, which may contribute to the exponential rise in debt.
If the masses stop paying or lose interest, this could be a cause for concern in the near future, further evidence of a system on the brink of collapse.

🗞 The internet changed information sharing forever; Web3 is doing for value what the internet did for Money.
💭 Matthew’s Thoughts…
This tweet by the CEO of Binance (the largest cryptocurrency exchange) highlights the importance and significance of new ways to transfer information and value globally.
20 years ago, people were skeptical about the new way of sending information across the globe with faster speed and lower costs, but today, such technology is widely adopted and considered the norm - known as the internet.
Now, CZ is suggesting that a similar transformation is happening in the way value is being transferred across the globe.
This new way of transferring value could potentially have a significant impact on the global economy, as it offers faster speed and lower fees compared to traditional methods, or what we call the legacy systems.
It’s very likely that blockchain could disrupt traditional financial systems and challenge the traditional ways in which value is being transferred and managed.
The implications of this could be far-reaching and could change the financial landscape in ways that are yet to be fully understood - especially given the lag in regulation and taxation of these digital asset networks.
As digital asset investors we must see the long term vision behind this technology and understand that global change takes time.
CZ Binance's tweet serves as a reminder, and foreshadowing of the continuous evolution of technology and the shifting paradigm we witnessing unfold in real time.

Fox MetaCapital’s Weekly Asset Review + Technical Analysis
📈📉 The Week Ahead in Charts
Symbols 📈 or 🐂 = Bullish / Positive | 📉 or 🧸 = Bearish or Negative | ⚖️ Ranging or Low Volatility
FOREX
📉 DXY(U.S Dollar) + 📈 CAD
💬 Matthew’s Commentary, Analysis & Prediction for the Week Ahead:
Off a hot jobs print out of the U.S on Friday the DXY printed bullish engulfing candle to end the week, with investor appetite for risk slipping on fears of an additional 25 bps rate hike in March.
Yet, when looking at the technicals on the 3-Day timeframe, we see that this candle print merely created a bearish retest of the 3-Day 100MA and for the time being shouldn’t be a cause for concern.
With the monthly fair value gap sitting just below the range support, I’m expecting one last dip into the low 100’s during February preceding the next FOMC meeting at the cusp of March.
A Fibonacci Extension was drawn to identify the .618 range (100.26 - 101.07) which will likely be the area investors are looking to establish long positions on the dollar heading into March.
This technical outlook favours risk assets in the short term 2<3 weeks but investors ought to de-risk and take profits following any signs of strength in this area as a fall into 100-101 would also print a high time frame swing pattern failure (‘SFP’) - famous for producing aggressive reversals.
With an untested yearly open, I’m expecting the dollar to revert to the 104 range in early spring before more data will be needed to judge market sentiment and macroeconomic conditions.
My bias continues to remain bullish on risk assets throughout 2023’ and I’m expecting the yearly open for the DXY to pose as a strong resistance.
Featured Chart DXY 3D (click to enlarge photo)

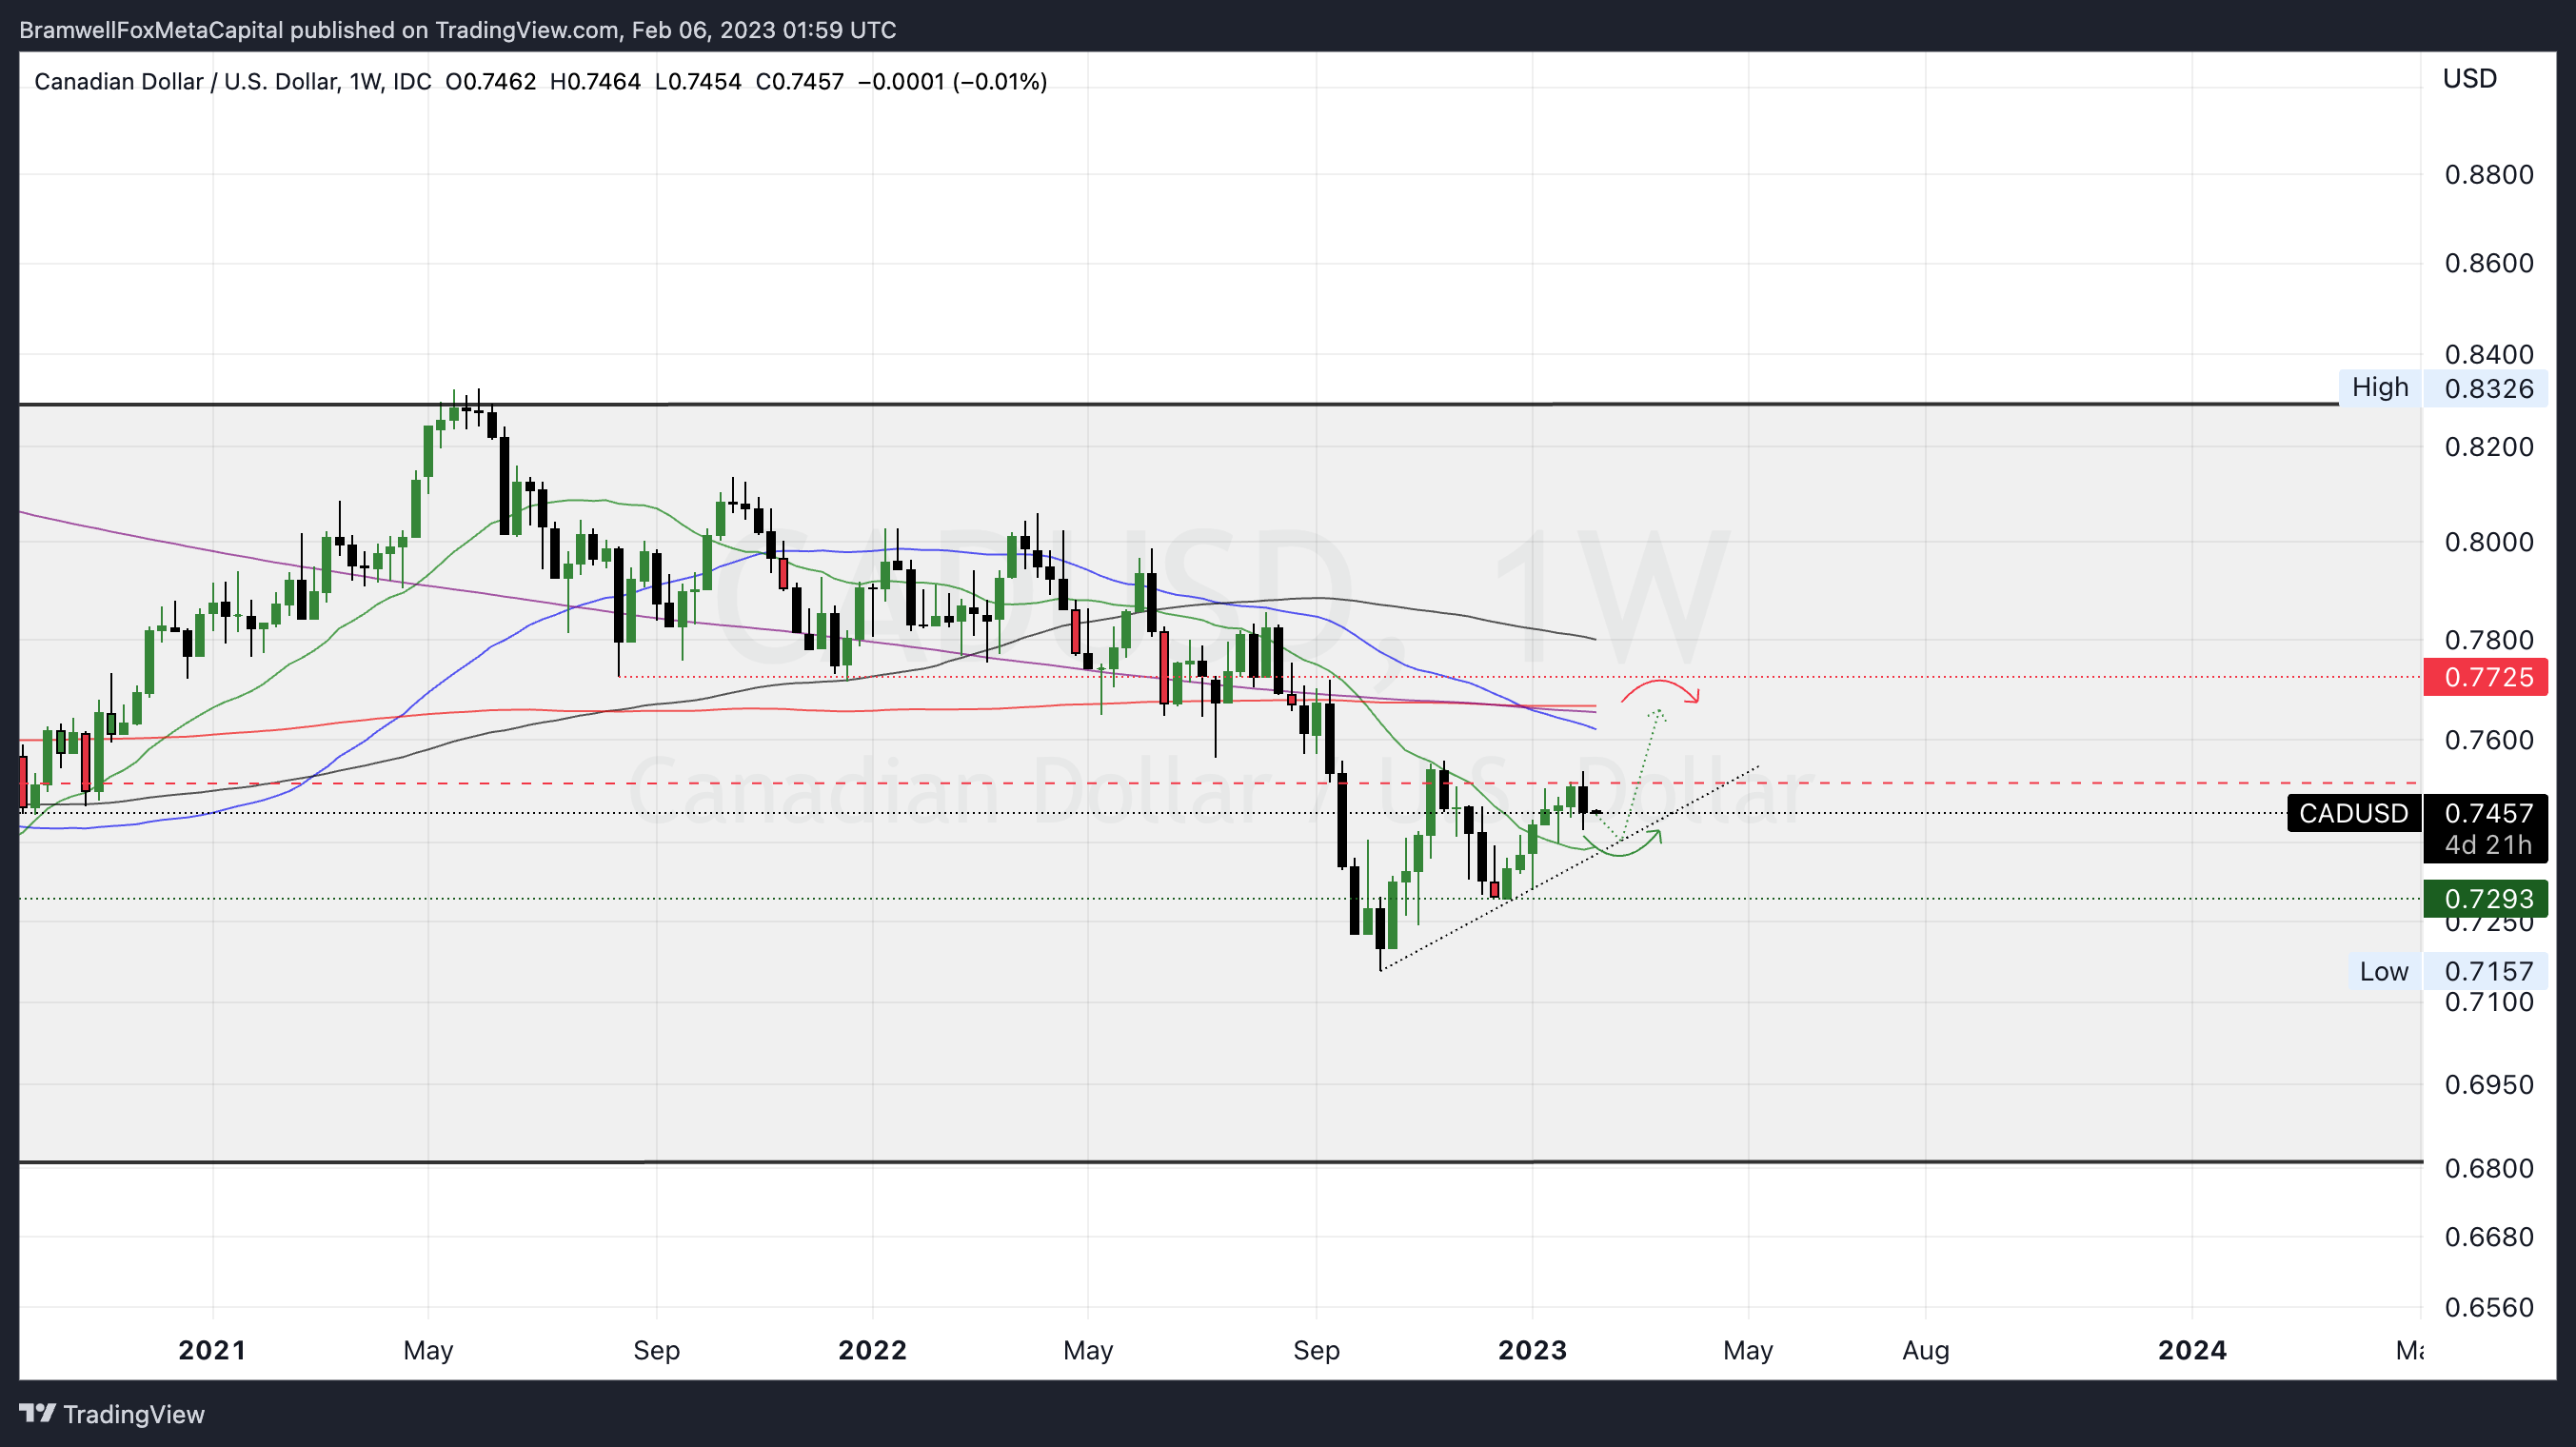
The Canadian Dollar has been in a steady uptrend for 2 consecutive quarters and is slowly approaching the weekly 200 moving average from underneath - possibly a bearish reaction is expected lining up with the timeline of a possible DXY reversal.
In the short term, I’m expecting the $CAD to have a short pullback into the low .74’s before a continued move upwards to the target area of .76 1/2 by early March.
I’ll be monitoring fiscal policy decisions and any headlines out of the Bank of Canada, including economic data releases on inflation, unemployment, housing and manufacturing to aggregate a clearer picture on global sentiment for Canadian treasuries and the demand for the maple leaf coin.
Featured Chart CAD 1W (click to enlarge photo)
Equities
📈 S&P500 + 📈 TSX & 📉 VIX
💬 Matthew’s Commentary, Analysis & Prediction for the Week Ahead:
FED Chairman J. Powell gifted the bulls nothing but green candles last week until a hot jobs report stole the spotlight as the dominating headline.
While the FED hiked interest rates another 25 basis points, investors faded the raise and chose to listen carefully to the word disinflation which was mentioned several times in the press conference by Chair Powell.
The S&P500 printed a bear market breakout with a strong move that nearly tagged the daily 400 MA before Friday’s price action reversed some of the gains experienced in the early-mid week.
From here, I would expect a retest of the bear market diagonal resistance in the 3975 region before a continuation upwards to the weekly range high with upside targets ~4350.
Once these high’s have been tagged, I’ll be looking for a high timeframe swing failure pattern to print and coincide with the next FOMC in late March.
Dollar cost selling may be a wise strategy through Q1 in the event of an aggressive reversal on risk appetite to end the quarter.
Featured Chart S&P500 1D (click to enlarge photo)

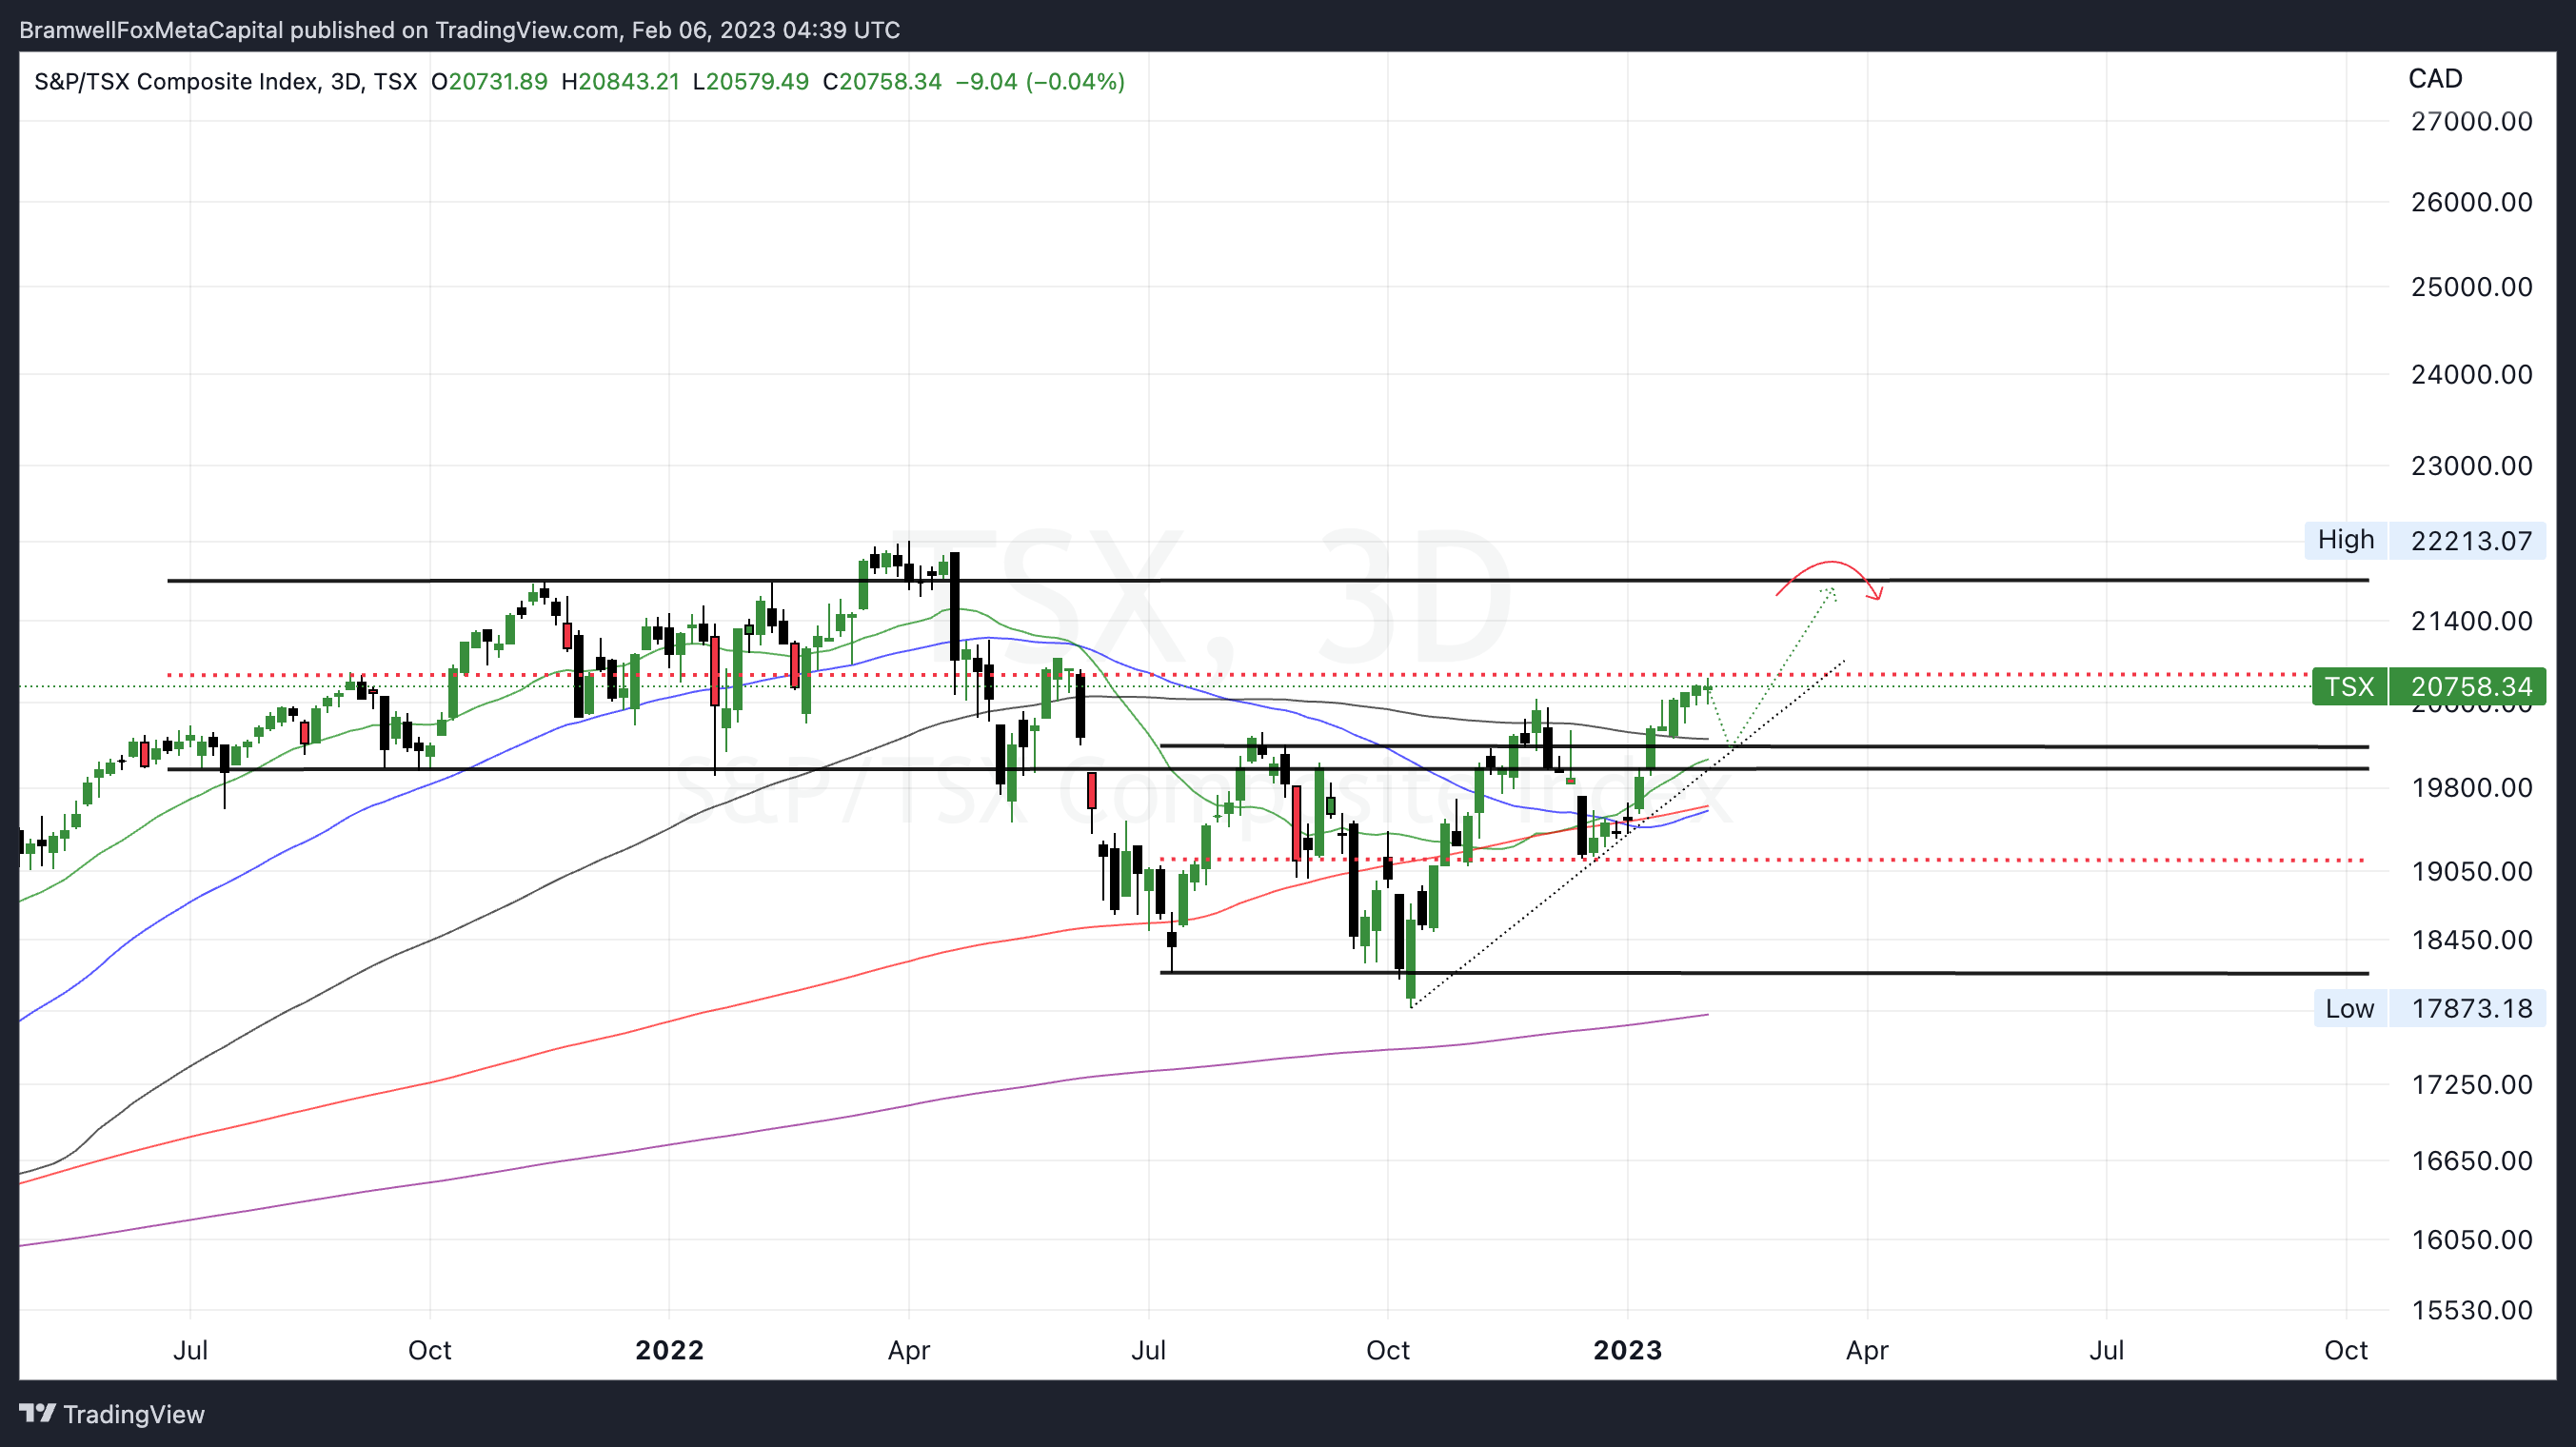
The majority of equity markets will show strength leading into the end of the first fiscal quarter of 2023 - the TSX being one of the leaders.
In the short term, I’m expecting the TSX to confirm range support ~20,200 before continuing its next leg upwards retesting the all time high regions 21.75K - 22K.
Featured Chart TSX 3D (click to enlarge photo)
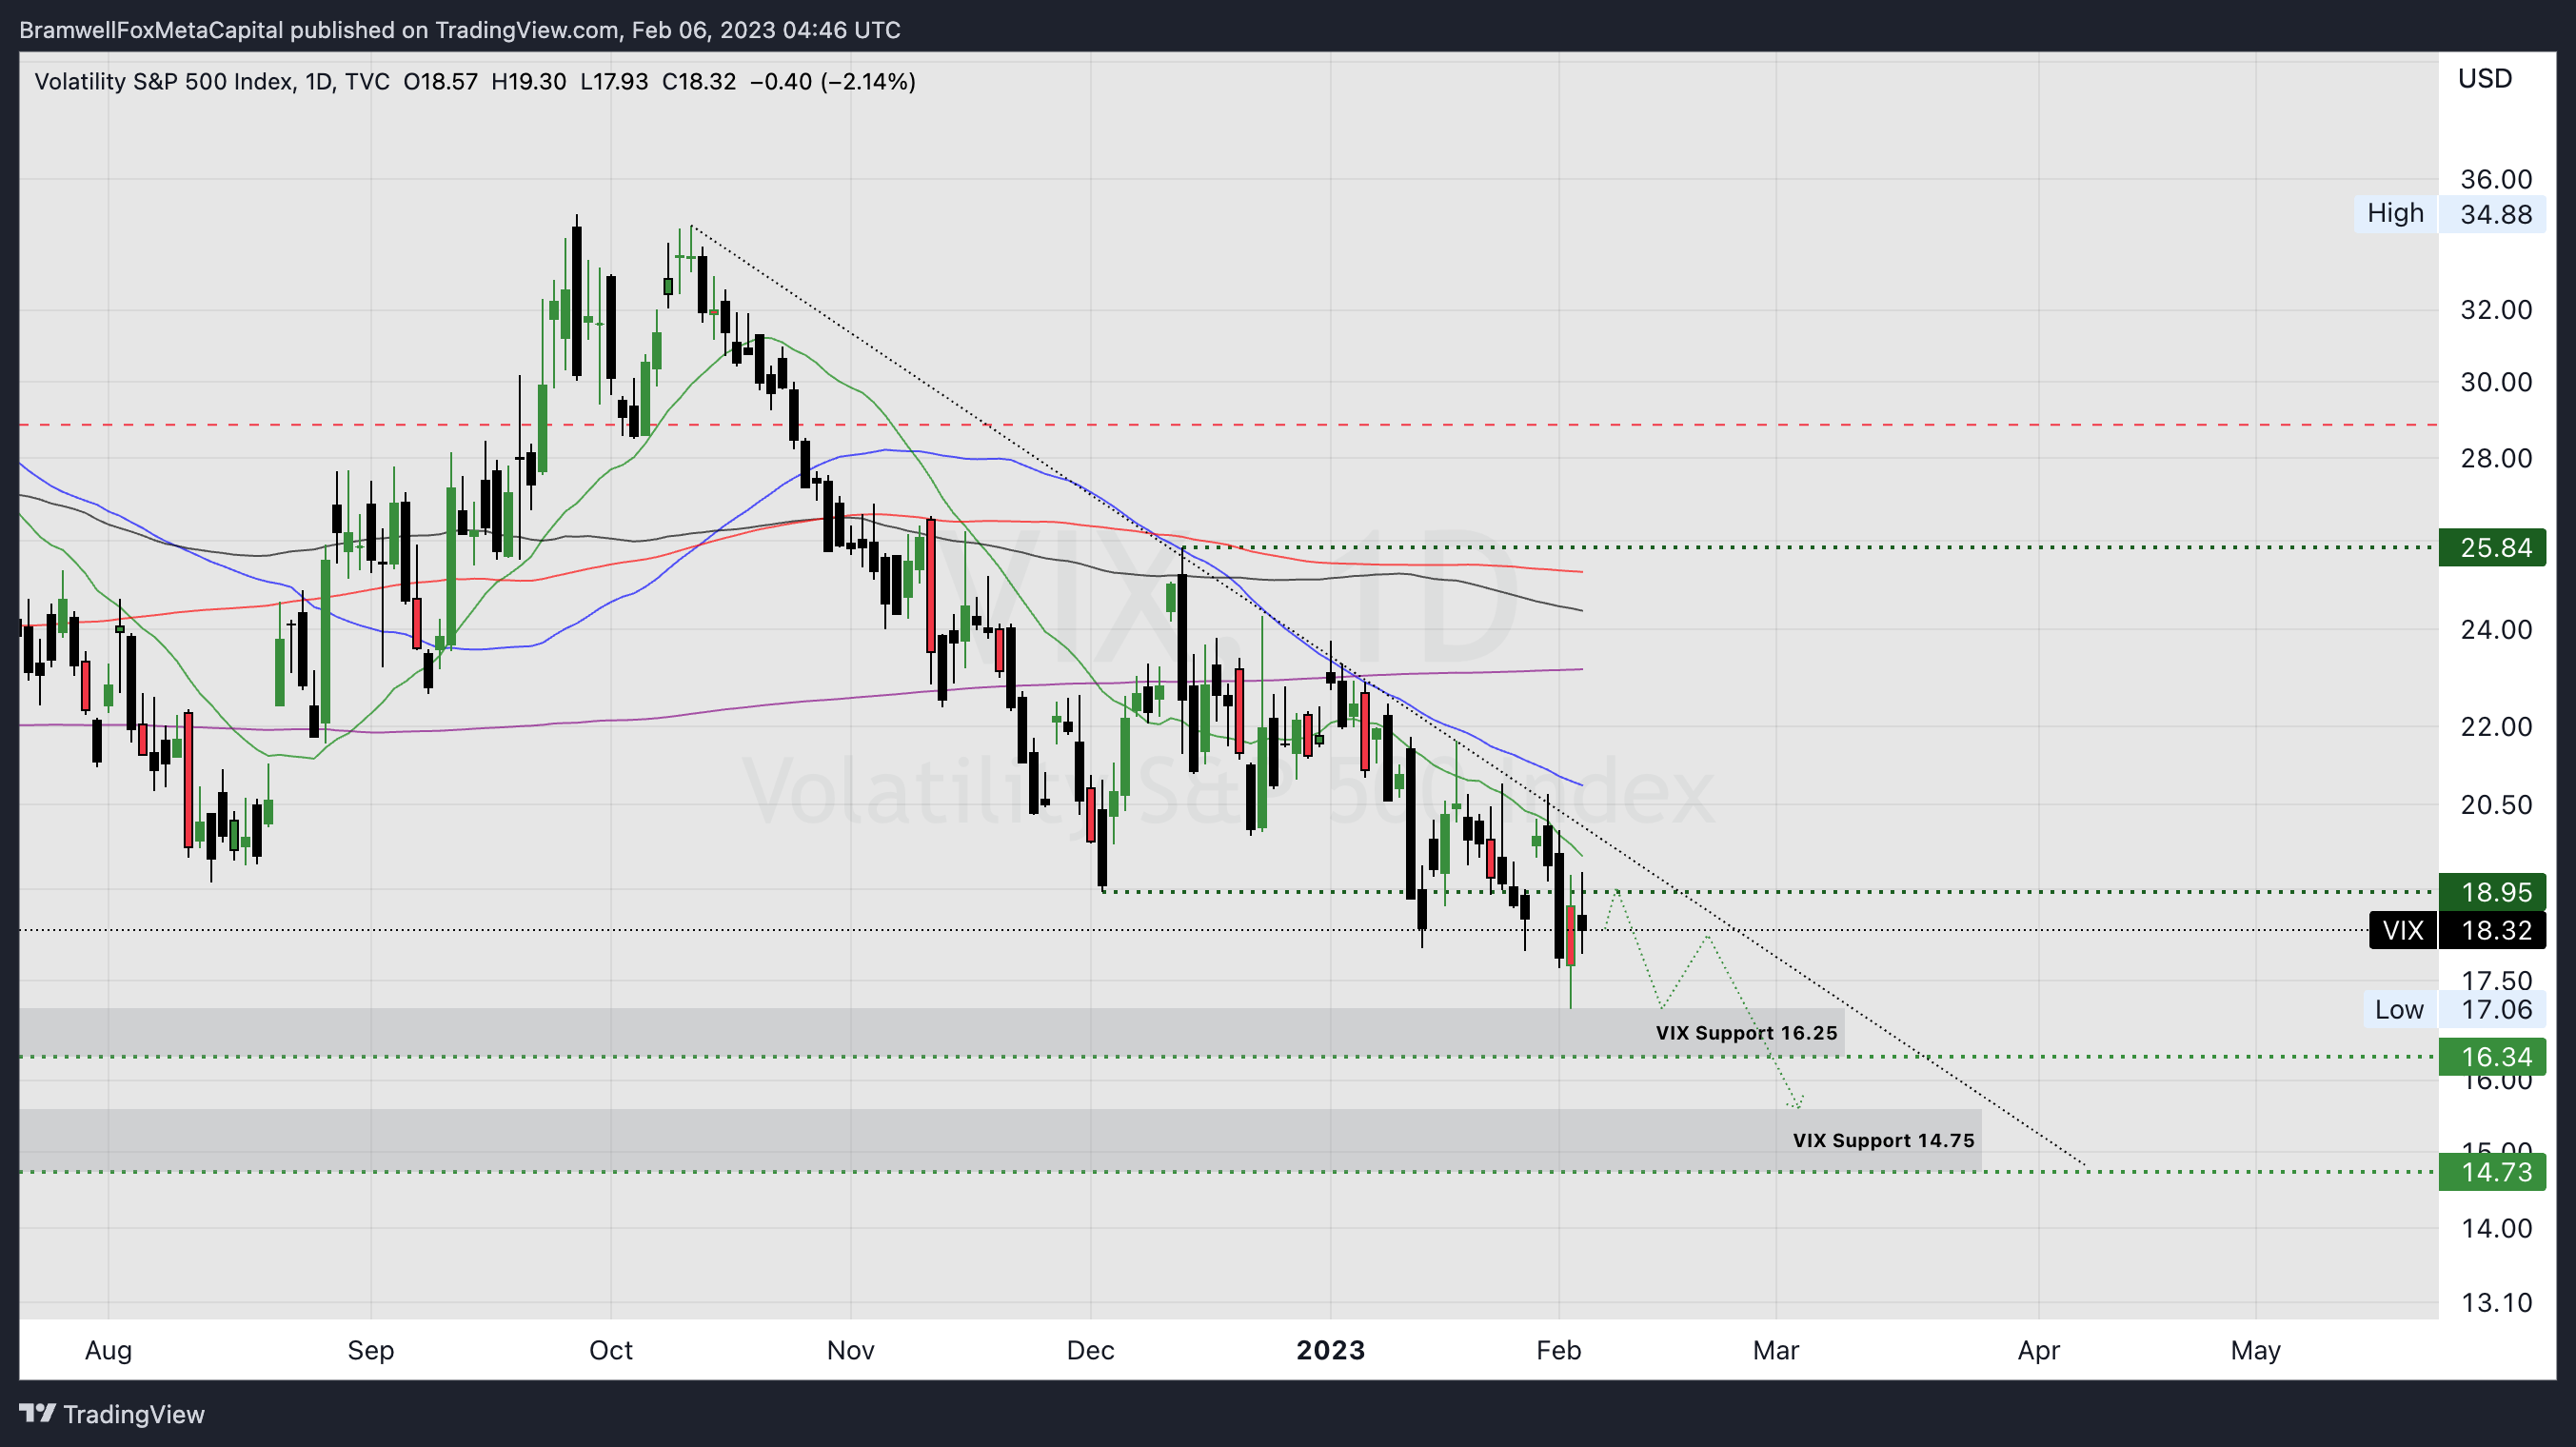
While many are calling for a VIX reversal and increased volatility to return to risk assets, I’m anticipating the further decline into the low 16’s and possibly a short trip downwards into the 14.75 region.
The VIX has pressed up against the downward sloping resistance across many touch points and it won’t be long until a breakout finally occurs; however the confluence of a weakening DXY rally and a short living S&P pullback supports this thesis on the path of the VIX until late March.
Featured Chart VIX 1D (click to enlarge photo)
Treasuries
📉 US2YR & 📉 US10YR
💬 Matthew’s Commentary, Analysis & Prediction for the Week Ahead:
It’s challenging to get a strong read on Treasuries as they opened on the week gapping upwards towards the downward sloping resistance.
It’s important to remember that yields increase when bonds demand decreases - thus a sell-off in the bond market can signify a rotation into risk assets or speculation on further hawkish monetary policy by the FED.
I’m choosing the former bias as other indices are showing support for capital rotation into equities and cryptocurrencies leading to the treasury sell-off.
Featured Chart US2YR 1D (click to enlarge photo)

It’s worth noting as well that off a hot jobs report many are now cancelling the recession fears that loomed for so long.
Yet, the proof we seek will be a steepening in the yield curve and the rate of change for the 2-year decline to outpace the 10-year to reestablish equilibrium in market sentiment towards the short term and long term outlook on government debt.
Featured Chart US10YR 3D (click to enlarge photo)

Cryptocurrencies
📈 ⚖️ Bitcoin + 📈 ⚖️ XRP + 📈 ⚖️ Total Crypto Market Cap
💬 Matthew’s Commentary, Analysis & Prediction for the Week Ahead:
We’ve been accurate year to date on the path of Bitcoin after marking the recent range deviation below 18K as a prime accumulation zone.
The bullish thesis reserves the right to assume no further capitulation will occur below 18K and that the bottom on Bitcoin is in.
Below, we are approaching the weekly range high (~25K) forming small clusters of consolidation without any significant pullbacks since our move up began to open 2023.
Currently, Bitcoin is ranging between 22.3K and 23.8K with two daily fair value gaps below that may wish to be filled in the coming weeks and months.
Is that time now? I do not believe so.
Rather, I’m seeing the possibility of a quick bear trap to the downside printing a swing failure pattern on the 12HR or 1D timeframes followed by a quick reversal to the weekly range highs and a retest of the daily 400MA (purple) in the 27.5K region.
Once this area has been tagged, I can confidently expect the timelines to coincide with the DXY bounce from support which should trigger a de-risking sell-off to which I’ll look for those fair value gaps to be cleared or at the very least the high 19K’s retested as support.
Featured Chart BTC 1D (click to enlarge photo)

Altcoins will likely tag along behind Bitcoins lead.
For $XRP, I’m expecting a similar path to unfold where the range highs are taken in the mid 40’s before a sharp reversal takes place clearly the daily fair value gap and lining up with a possible Ripple vs. SEC settlement.
This current trading range offers an excellent dollar cost averaging zone and fantastic risk/reward ratio for those hedging long on a favourable Ripple lawsuit resolution.
Featured Chart XRP 1D (click to enlarge photo)

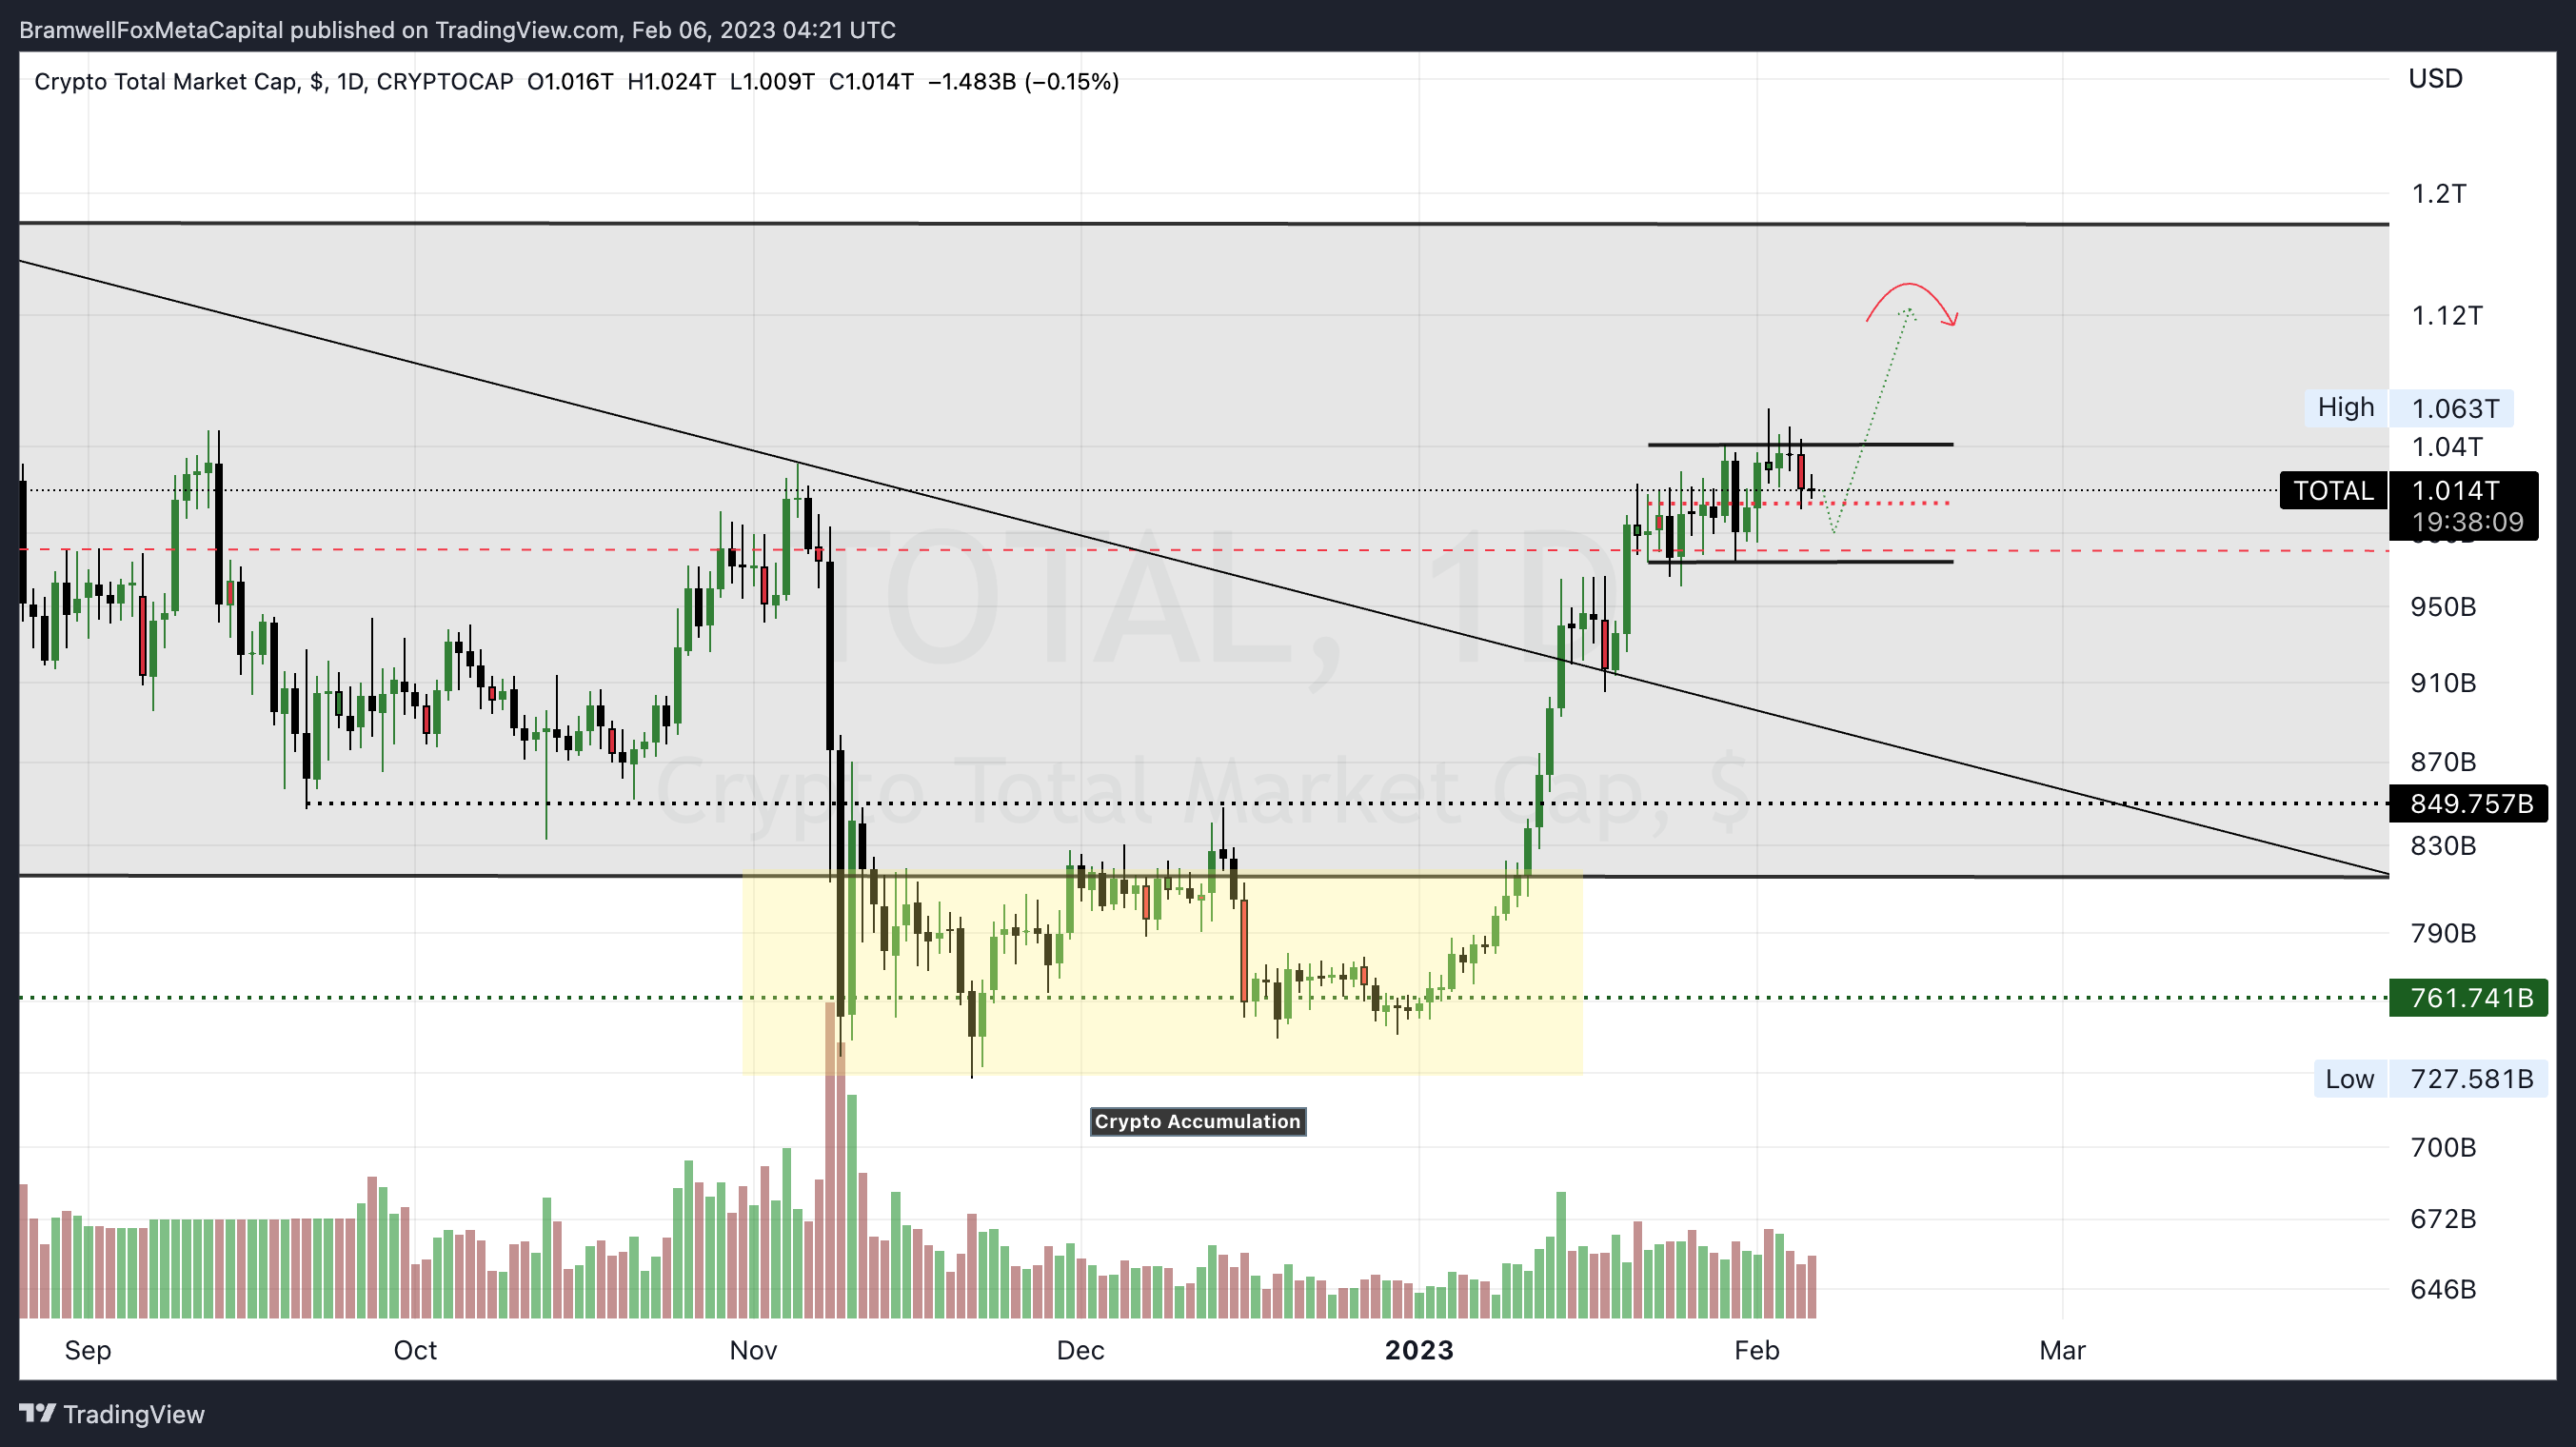
The Total Crypto Market Cap recently reclaimed a $1T market cap and is now ranging at the local highs.
I would expect for the total market cap to inflate by 8-10% from this range with targets set on $1.125T as the quarterly 3M high.
All eyes on Bitcoin dominance to further calculate how much capital will flow into alt-coins.
Featured Chart TOTAL 1D (click to enlarge photo)
Commodities
📉 Oil + 📉 Gold & 📉 Silver
💬 Matthew’s Commentary, Analysis & Prediction for the Week Ahead:
I’ve been waiting on $65 per barrel oil for months now and I believe the day is closing in.
Oil was recently rejected from its bearish trend-line and will attempt to find support across the weekly range median in the coming days.
I’ll be watching for geopolitical headlines to signal bearish pressure for Oil on the horizon as a break below the median will bring about the 3-Day 400MA retest we’ve been watching along the range low support area.
It’s worth noting that I’m short term bearish on Oil however I am expecting a reversal to occur mid-summer with Oil possibly retesting $85-90 per barrel by the fall.
Featured Chart Oil 3D (click to enlarge photo)

We successfully identified this move on Gold perfectly.
Next, I’m expecting disinflation to deflate the price run up on Gold and for a multi week correction to occur.
I’m looking for longs along the 1.785K per oz region and will be watching the strength of the DXY as I follow all headlines relating to international economic growth as a foreshadow of Gold’s next move.
Featured Chart Gold 1D (click to enlarge photo)

Silver is looking to retest the range lows before a possible breakout occurs to the upside.
I’m targeting $25-26 per oz by the summer.
Featured Chart Silver 2W (click to enlarge photo)

👋🏼 Hey!
Thanks for reading this week's Weekly Market Update Edition No. 029
If you have any comments, feedback or questions on any material written in this edition please share as I'd love to continue a dialogue below.
If you enjoyed the read, I’d really appreciate if you’d share our community with your network of friends, family & fellow investors!