


🗞 Weekly Market Newsletter | Edition No. 25
🎉 Welcome to 2023' | News Update + A Full Analysis of Major Indices Including Stocks, Crypto, Commodities, Bonds & Forex

Sunday, January 8th, 2023
Hello Friends,
Welcome to the first 2023 edition of Fox MetaCapital’s Weekly Market Newsletter on substack!
👋🏼 I want to take a moment to thank each and every one of you for being a part of my substack community - your trust in me is deeply appreciated and I wish nothing short of good fortune, the best of health and many moments of joy in 2023’. - M
To kickstart the year I want to announce the rebrand of our substack to Fox MetaCapital - (take a peak👇🏼)

It’s a subtle and small change but super meaningful towards the big vision I have long term for this project.
You’ll also notice I improved the aesthetics of our Fox MetaCapital homepage and added new feature pages including our very own Podcast and Video section to be launched this year - be sure to save us as a bookmark for easy access!
Alright, let’s dive into my thoughts for 2023…
As we start the year the main narrative dominating the minds of global investors is the dark recession cloud forming overhead of the world’s leading economies.
One could say the world is only now experiencing hangover symptoms from a drunken night of liquidity *shots* that flowed down the throat of the global financial system - poured directly from the flirtatious hands of the cute bartender, dressed as a central bank.
It’s important to remember that recessionary cycles occur when economic activity contracts or shrinks, meanwhile the opposite effect, growth cycles, occur when economic activity expands.
When economic activity shrinks, we naturally think of;
Jobless claims increasing (ie. rising unemployment rate due to layoffs)
Bankruptcies cascading, both consumer and corporate.
Corporate earnings falling, due to lower consumer demand and higher costs to produce goods and services.
Interest rates peaking, due to the monetary policy decisions aimed at slowing the pace of inflation and soaring costs.
Asset and portfolio valuations plummeting as investors scramble to convert poorly performing securities into cash.
Consumer discretionary spending decreasing and consumer credit facilities nearing their limits.
Most of these events should sound alarmingly familiar from the headlines we covered last year;
The U.S Federal Reserve FOMC meetings became the Superbowl of financial markets as we watched market volatility spiking and valuations plunging to new lows with every rate increase announcement.
Blue Chip stock market behemoths such as Tesla, Netflix, Peloton, Twitter & Facebook all recording record losses in market cap valuations.
The War fought over Ukraine resulting in Oil prices and subsequently Gas prices to new all-time highs with consumers worldwide digging into their savings to cover the spread on rising cost of goods and transportation.
Disruptive technologies such as cryptocurrencies and growth stocks primarily in the technology sector bled from investor capitulation, bankruptcies and even fraudulent activity from bad actors who were over-leveraged from speculative and malicious behaviour.
The currency wars resulted in the U.S Dollar (DXY) absolutely ripping up the FOREX market as treasury yields soared sending shock waves through the equity and bond markets.
Inflation data across the globe setting decade and century all-time highs for some nations; including the United States, U.K and Canada.
We’re all left wondering the same thing - is the worst behind us?
Truth be told, I’m personally unsure.
When I turn off my computer and go outside into the real world, visit our local stores like my favorite coffee shop, and our small-town city mall, I really try to do my best to breathe-in the reality of my local economy.
What am I looking for?
Well, I’m looking for long lines and crowds in the stores, but they are nowhere to be found.
I’m watching for smiling faces and spontaneous joyful spending, to be honest most I find are quite grumpy.
I’m looking at inventory levels and “On Sale” signs, but the shelves look lacklustre and selection bleak.
When I truly look around and ask myself if the economy feels on the up & up, my honest answer is No.
At least, not yet.
Which means I can’t allow my deeply-optimistic long term bias to blanket my perspectives in the short term.
We can’t allow our hope and naive bullish wishes to distort what the charts are showing us may occur in the immediate future.
We must allow time to reveal the story the market is longing to write and both hedge correctly in anticipation of further recessionary signals, meanwhile gaining our composure and realizing that the masses are generally terrible at calling market bottoms.
The logical investor is on a mission to dollar-cost average into assets that align with our portfolio strategy meanwhile continuously assessing our tolerance for risk and prioritizing cash flow management that float everyday living expenses.
The worst may not be behind us and it’s important to be prepared for another year of ranging and/or falling asset prices.
Yet in the same breath we must be peripherally aware that the early months of 2023’ may unfold events that completely flip the script.
There is only one thing we do know for certain.
No matter if the markets go up, down, left, right or inside-out, I promise to be in your inbox every week covering the major market news and moves detailed in our weekly newsletter.
My commitment to all of you in my community is to make Fox MetaCapital one of your favourite places to invest your attention each week in 2023’, so stay tuned for an outline and roadmap post of what to expect from your subscription this year.
We’re about to jump into our first look at the charts for the year as I’ll be delaying reporting on major news headlines until next week to allow some space for early narratives to develop that I’m watching closely.
Enjoy the rest of the edition and I’m grateful for your trust in my guidance through these very paradigm shifting financial times we’re living in.
- Matthew Fox
ps. the 🔑 is to follow my twitter as I share, comment and retweet real-time events as they unfold during the week.
Fox MetaCapital’s Weekly Asset Review + Technical Analysis
📈📉 The Week Ahead in Charts
Symbols 📈 or 🐂 = Bullish / Positive | 📉 or 🧸 = Bearish or Negative | ⚖️ Ranging or Low Volatility
FOREX
📉 DXY(U.S Dollar) + 📈 CAD
💬 Matthew’s Commentary, Analysis & Prediction for the Week Ahead:
The DXY takes the top spot as ‘Chart-of-the-Year’ for 2022 as we experienced what could be the distribution top (see highlighted yellow zone below) of a 14-year long bull-run for the U.S Dollar.
Only time will tell.
Looking at the daily timeframe the DXY attempted a breakout of the falling wedge formation only for the price to get rejected harshly at 105.63 with a bearish engulfing candle that sent the Dollar back down near range lows (green zone) as we open the week sitting on 103.5 support.
Featured Chart DXY 1D (click to enlarge photo)

Zooming in on the 12HR lower timeframes I’ve mapped out the possibility of the DXY re-entering the wedge formation and possibly plummeting into the bottom range (yellow shaded zone) reaching the lows of 102.75 - 103.
The week ahead is highlighted by Jerome Powell speaking on Tuesday followed by Core Inflation Data and Jobless Claims released later in the week.
Certainly these events will be worthy of our attention and may affect the volatility and path of the DXY.
But in the short term, it looks bearish in my opinion which does favor a return to risk assets early in the year.
Featured Chart DXY 12HR (click to enlarge photo)

Canada posted lower than expected jobless claims to start the year which may provoke the Bank of Canada to continue their rate increases in Q1, therefore it’s of my perspective that the Dollar may experience a rise in value evident by its current bounce from support ~ .7293 and en route to my expected sweep of range highs ~75.6 into my target area of ~76.5 - 77.5 in Q1.
Featured Chart CADUSD 1D (click to enlarge photo)

Equities
📈 S&P500 + 📈 TSX + 📈DJIA + 📉 VIX
💬 Matthew’s Commentary, Analysis & Prediction for the Week Ahead:
The S&P finished 22’ knocking on the down-sloping bear market resistance line only to get rejected as investors took profits to close out the year as a liquidity-exit hedge on the uncertainty that 2023 may bring.
Yet, the bulls stepped in and defended ~3750 and it’s possible that with the right ingredients we could breakout of the bear market trend and begin consolidating to form a bottom before the equity index gains steam on the backs of rate pivots and a cooling economy.
On the weekly chart, I’ve mapped out the ideal bullish path for the S&P meanwhile, below we’ll explore what this looks like on lower timeframes.
Featured Chart S&P500 1W (click to enlarge photo)

Zooming into the 12HR we have a critical region of supply (red zone) coming up between 3925 - 3950, flip this into support + clear the price gap (grey zone sitting above) and we have the potential for a breakout.
This is promising price action, but we shouldn’t get too excited yet.
Featured Chart S&P500 12HR (click to enlarge photo)

Furthering our bullish spirit, the TSX is showing ambition to clear the 19.8K resistance and enter into the range < 22.2K which would mean possible new all-time highs for the Canadian equity index in 2023.
Although should we reject from 19.8K, a revisit to 17K may unfold which wouldn’t be ideal for any bullish thesis on the Canadian economy.
Featured Chart TSX 1W (click to enlarge photo)

The Dow Jones was the first to break out of its bear market and has officially re-tested 32.5K as support, this is an excellent signal.
We now set our sights on clearing 35K before speculating on new all-time highs for the Dow Jones.
Featured Chart Dow Jones Industrial Average 1W (click to enlarge photo)

Keeping my inner bull in check, the VIX is showing signs of bearish energy, looking to re-test the 3D support ~18.95 with a possibility of re-testing the early 2022 lows 16.34.
Remember, the VIX is a measure of the volatility of the S&P500.
Historically, a free-falling VIX signals a bullish sentiment in the market.
Featured Chart VIX 3D (click to enlarge photo)

Treasuries
📉 US2YR & 📉 US10YR
💬 Matthew’s Commentary, Analysis & Prediction for the Week Ahead:
The inverted yield curve was the doomsday economists' theme in 2022.
Remember that when the 2YR rate > 10YR rate this is known as an inverted yield curve and signals that investors are speculating on higher risk in the short-term than the long term, signalling fears of a short-term breakdown of economic vitals.
In aggregating more evidence towards a bullish return to risk thesis, the 2YR didn’t disappoint with a bearish engulfing candle forming on the 1D leading me to believe the target yield may fall back into the lower half of the range, a breakdown below the most recent breakout line and possibly collapse into the 3.5% region (green zone).
This would be bullish for signalling the confluence of a market bottom.
Featured Chart US2YR 1D (click to enlarge photo)

Ditto to the 10YR as the 2D chart is equally showing weakness on yields and on a path to fall into the .618 fib zone of 3.4 - 3.5%.
I’ll be watching for the pace to which the 2 vs. 10 year yields move as should the 2-yr collapse faster, the less likely the depths of a recession loom.
Featured Chart US10R 2D (click to enlarge photo)

Cryptocurrencies
📈 Bitcoin + 📈 XRP + 📈 Total Crypto Market Cap
💬 Matthew’s Commentary, Analysis & Prediction for the Week Ahead:
The godfather of crypto is teasing us with a falling wedge on the weekly chart with the most dangerous region of supply marked at 18.2K.
Most chart analysts in 2022 were calling for a 10K - 13.8K Bitcoin bottom and we can’t blame them for their accuracy as noted by the most logical demand zone remaining should we experience rejection from the wedge resistance.
Featured Chart Bitcoin 1W (click to enlarge photo)

Zooming into the 12HR, I’ve added a fib retracement to make a note of important areas to watch in the coming days and weeks.
At the time of writing this the equity futures markets opened green, the DXY is falling and Bitcoin reached a high of 17.2 on the day.
This price action sweeps the 0.5 fib and we may experience a short pullback into 16.8K before setting sights on our major breakout region marked by the yellow highlighted circle and black path to 18.2K.
Any meaningful strength in the DXY, further crypto-related legislative FUD, and/or bankruptcies in the ecosystem may deliver a knock-out punch to any bullish rally at the time - all eyes on the events unfolding in the coming weeks.
Featured Chart Bitcoin 12HR (click to enlarge photo)

XRP is also sitting on major support with a huge head and shoulders formation seeking invalidation in the coming days.
At the time of writing XRP is ranging between .34-35 cents and seeking a move upwards and flip .37 cents into support before attempting a significant breakout.
We can see by the volume profile located to the right of the price action on the chart that the POC for XRP (yellow line) is located smack-dab in the heavy demand zone for XRP ~ .25
While it wouldn’t be my overarching preference to see XRP tag these lows, it’s looking very possible unless a catalyst changes the sentiment within the next few days.
Should upside volume occur, potentially due to the highly anticipated Flare Networks airdrop happening tomorrow, January 9th, or further unfolding events surrounding the lawsuit, settlement or judgment, we have the potential at these price zones to see XRP take flight.
Featured Chart XRP 1W (click to enlarge photo)

Zooming into the 1D, the path to riches would involve flipping the .618 fib (~ .37) into support, allowing for a push-up and re-test of the .40 range.
Reclaiming .40 cents would allow for the breakout potential from the descending year+ long bear market trend and XRP to sweep the highs of the 1W range ~.55 cents.
In short, we are either getting XRP for a quarter in the short term or two for a dollar.
Featured Chart XRP 1D (click to enlarge photo)

When we ask ourselves how the overall crypto market is performing as an asset class we must take a look at the high timeframe weekly chart below.
We have a weekly range (top to bottom) between $750B and $1.18T in liquidity with the price action forming a descending triangle - typically a bearish formation.
I’m not encouraging anyone with a weak stomach to look down as we see an absolute skydive freefall into the next region of support marked by the ~400 Billion green zone, a massive capitulation would have to be on the horizon for this scenario to occur.
This is why I always say ‘show me the charts, I’ll show you the news’.
Head on a swivel for regulation and or bankruptcy headlines.
Featured Chart Total Crypto Market Cap 1W (click to enlarge photo)

Zooming in to the 12HR chart and we gather a little more certainty.
We had several fake-outs to the downside for the total crypto market cap and following that price action we are experiencing short term impulsive upward moves, this is mildly promising.
Our first test will be clearing the .382 and .5 fib regions and within 4-6 weeks make an attempt at breaking out above the 900B - 950B resistance, confirming our market bottom has likely been reached.
Featured Chart Total Crypto Market Cap 12HR (click to enlarge photo)

Commodities
📉 Oil + 📈Gold & 📈 Silver
💬 Matthew’s Commentary, Analysis & Prediction for the Week Ahead:
I read a Russian Government official claim that in 2023 we are likely to see oil pushing $150 a barrel.
For that to occur we would expect for the first quarter of 23’ to gather the liquidity needed by touching down in the $62-5 - $65 per barrel demand zone followed by a geopolitical catalyst that sends oil on a supply shock tear upwards into the $100 per barrel region by mid-late 23’.
I’m unsure if this is possible, but I am watching closely the reaction to Oil at this .786 fib zone acting as the last line of defence before a test of the $65 region marked in green below.
Generally, I like to assume lower Oil prices means a more peaceful world, thus, my attention is watching for Russia v. Ukraine positive news developments and or OPEC+ related headlines negotiating with Western nation counterparts.
Featured Chart OIL 1W (click to enlarge photo)

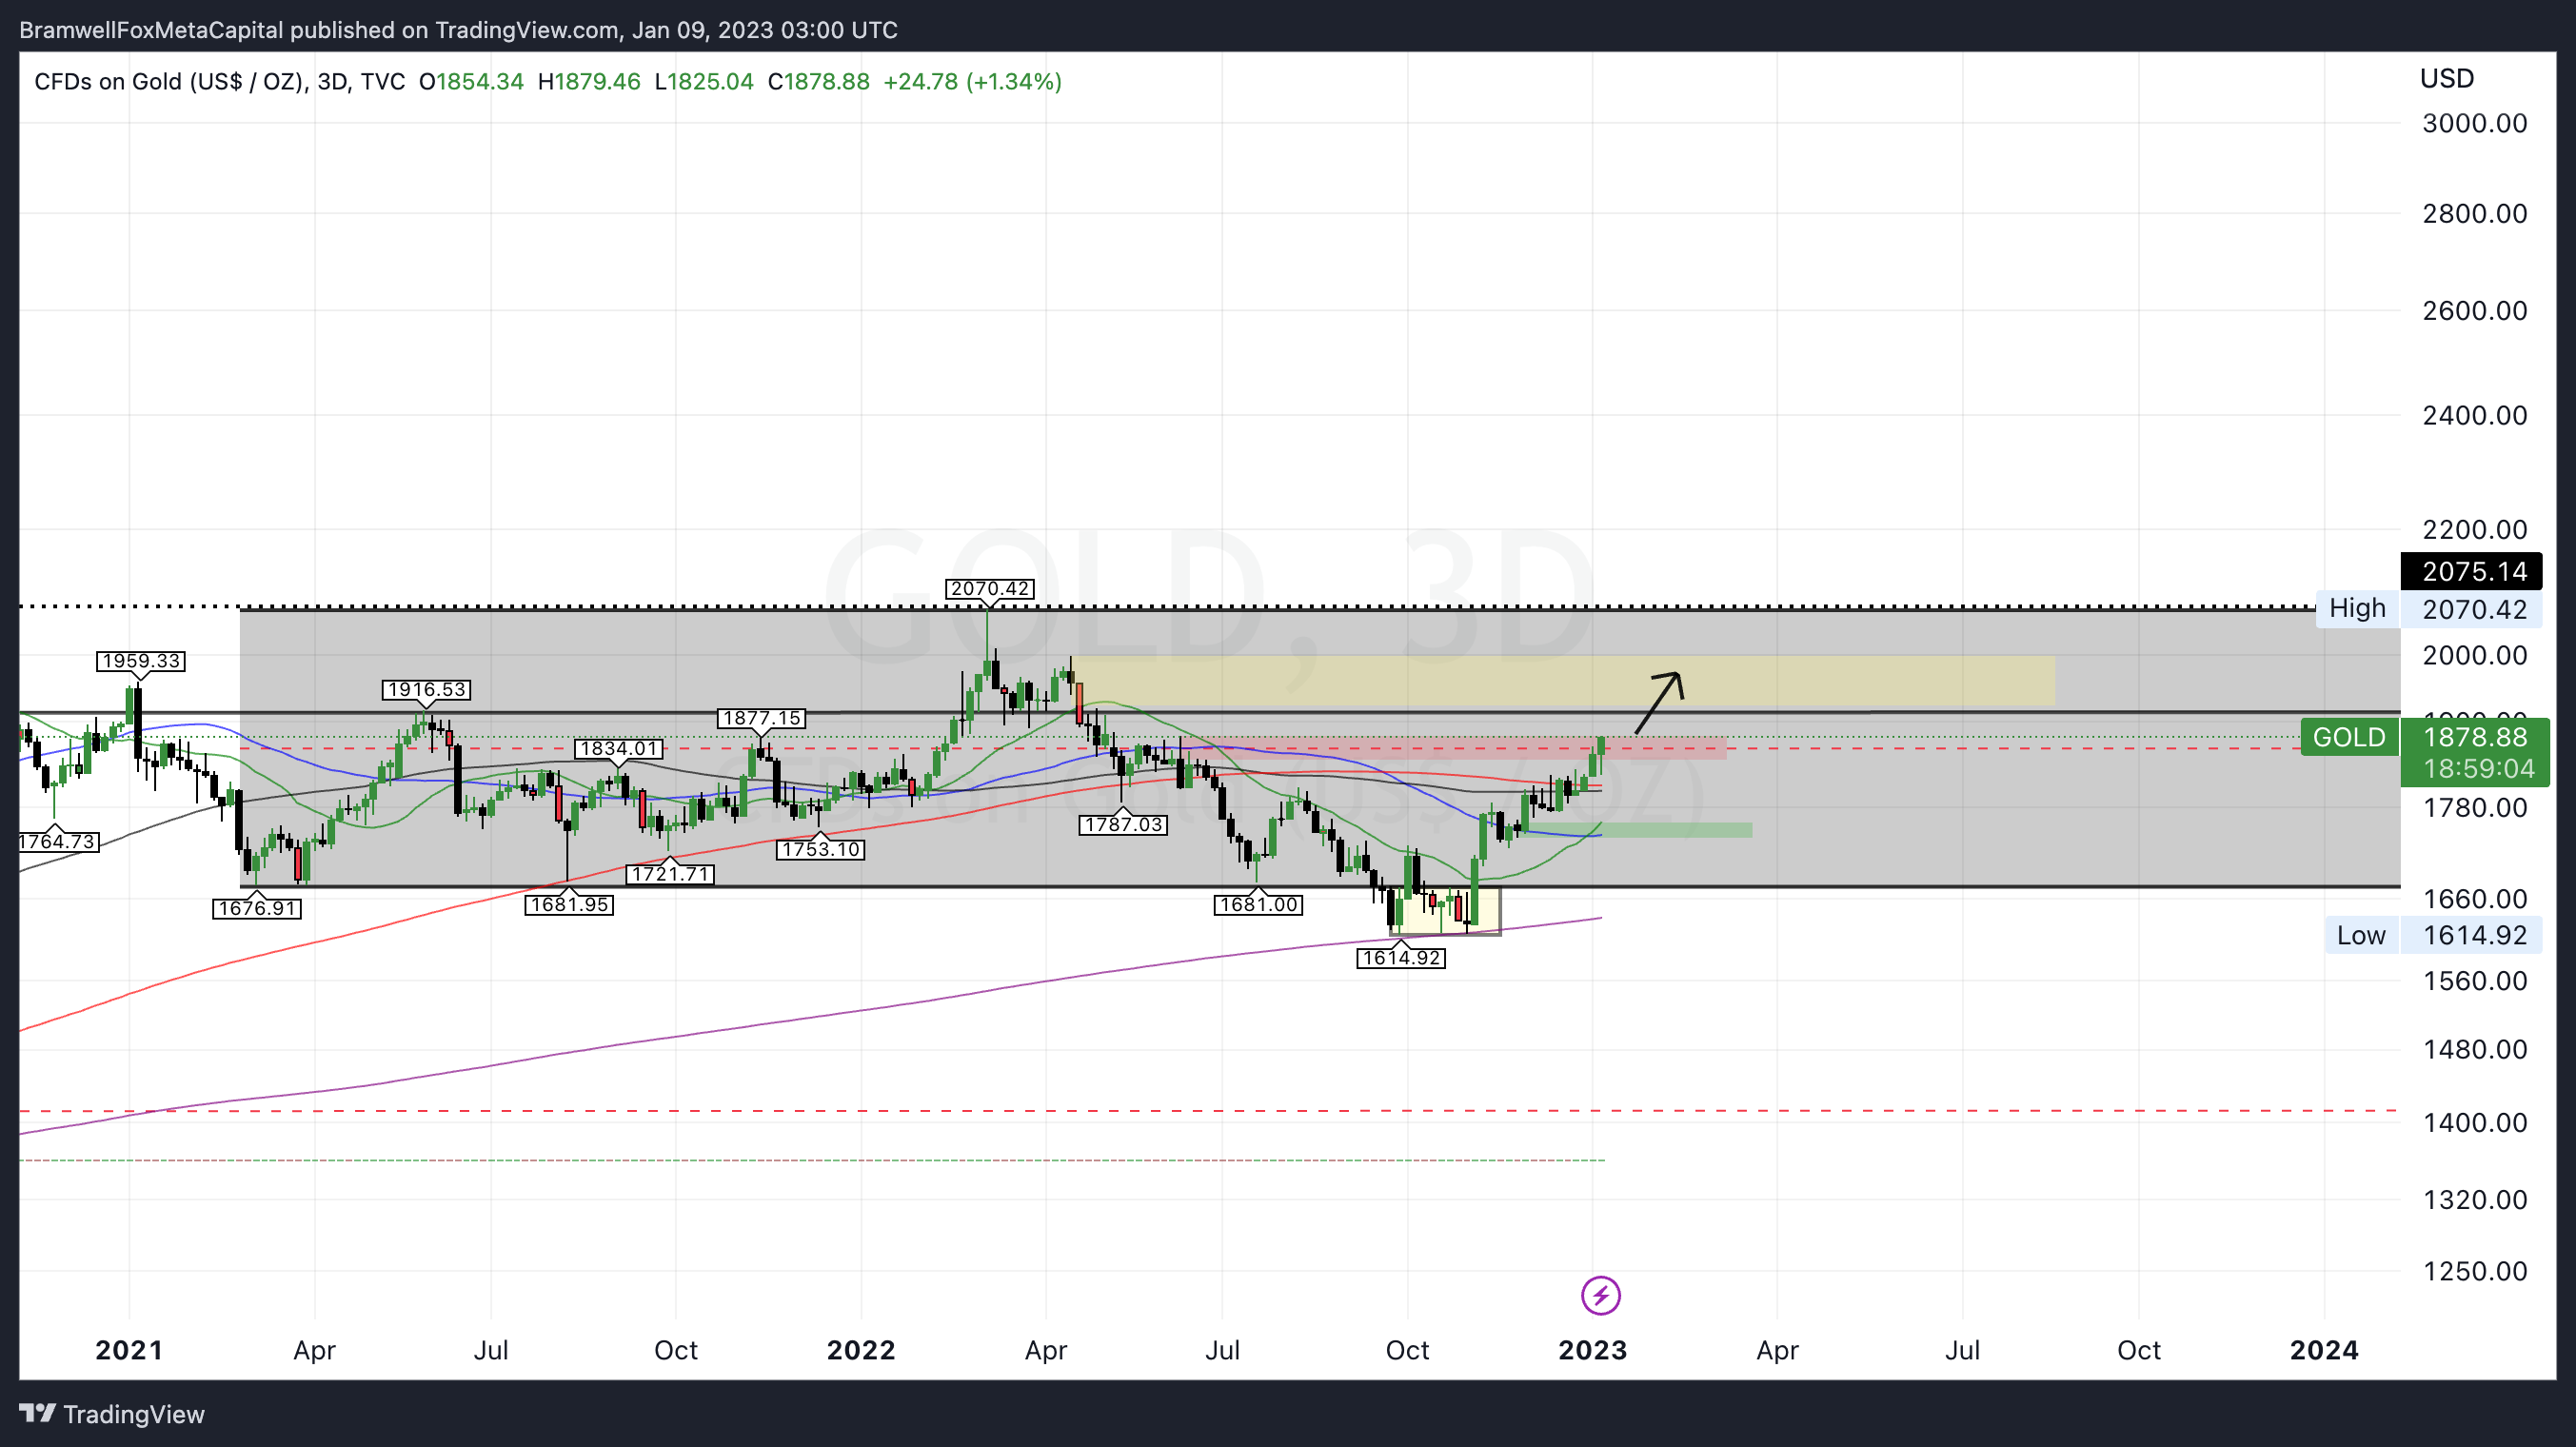
The most exciting chart(s) of the year are both Gold and Silver, which finished 2022 on a run.
Rising metals are typical of a return to inflationary or expansive economic environments.
With the DXY showing weakness and long-standing conspiracies rumours of IMF SDR baskets of currencies becoming pegged to hard money sources, the speculation is enthralling to add more metals into our portfolios.
Below I show the 3D chart for Gold, and we are seeing price expansion heading towards the range high yellow zone of the mid 1900s - 2K per oz price region.
Furthermore, the 1M chart is even more exciting.
Featured Chart Gold 3D (click to enlarge photo)
On the 1M chart we observe the 50M moving average (blue) being tagged and the price heading with steam to make all-time highs should a breakout above $1.9K occur.
Potentially a short term pullback may be needed, but this chart is looking strong as we’re only 1 week into the year.
Are investors forecasting a weakening U.S Dollar?
Featured Chart Gold 1M (click to enlarge photo)

The 2W Silver chart is equally as fascinating yet at a particularly make-or-break zone.
It’s important to remember that Silver is one of the most important metals for electric conduction and in a world shifting away from petroleum, this commodity is in high demand.
Price is currently pressing against the $24/oz mark.
With a rejection here, a retest and short pullback to $21 can be expected.
Should a breakout occur the target will be set on $27.5 by end of year.
Featured Chart Silver 2W (click to enlarge photo)

👋🏼 Hey!
Thanks for reading this week's Weekly Market Update Edition No. 025
If you have any comments, feedback, or questions on any material written in this edition, please share as I'd love to continue a dialogue below.
If you enjoyed the read, I’d really appreciate if you’d share our community with your network of friends, family & fellow investors!
Always look forward to your Newsletter / insight.🙌🏻