


🗞 Weekly Market Newsletter | Edition No. 12
News Update + A Full Analysis of Major Indices Including Stocks, Crypto, Commodities, Bonds & Forex

Sunday September 25th
Hello Everyone,
As expected, it was a week for the history books as all eyes were on Jerome Powell’s speech last Wednesday - he didn’t disappoint.
After announcing a 75 basis point interest rate hike, markets reacted by sending US treasury bond yields to new highs meanwhile foreign currencies and the stock market plummeted into a sea of red.
The good news: we (our portfolios) survived (so far) without too much damage from the hawkish monetary policy.
It’s worth mentioning as well that there exists a record number of short sellers in the market betting on further downside for risk assets, potentially setting up for a bear trap.
Why is this good? Because the herd mentality tends to always be wrong at calling market bottoms.
The bad news: if any further downside does occur, it may be aggressive.
Many of the worlds major indices are showing weakness including the Dow Jones, the S&P500, TSX, Bitcoin as well as commodities such as Gold & Oil.
Meanwhile, safe assets such as Treasuries and the U.S Dollar have enormous strength.
We are literally waiting any minute now for something to break in the financial markets.
The drama of 2022 continues this week, I’ll be watching every move.
Enjoy this weeks newsletter, let’s dive into the news and charts below.
- Bramwell
⚠️ This week, I’m going to switch up the format of our weekly newsletter by presenting the charts paired with the most important news headlines affecting their movements.
BramwellFox MetaCapital’s Weekly News Recap + Technical Analysis
Major News Headlines + Chart Predictions
🗞 Further Interest Rate Hikes | FOMC Meeting
Federal Reserve increased the funds rate by 75 basis points
Rate now @ 3% - 3.25% with a projected policy rate of 4.40% to end the year.
💭 Bramwell’s Thoughts…
I was on the edge of my seat Wednesday morning anticipating this event as I knew that the implications would be enormous for global markets.
The U.S equity and crypto markets experienced immediate volatility that set the tone for the weekly close drowning in a sea of red.
With the global macroeconomic landscape already looking bleak, the fate of the investment markets lay now in the monetary policy decisions being made by the Federal Reserve.
Chairman J.Powell didn’t hold back his hawkish tone, repeating the notion that combating inflation down to the target of 2% will come at the expense of lower economic growth and continued interest rate hikes until the job is done.
All eyes remain on the U.S Dollar which shows no signs of slowing down in the immediate short term and the CPI data releases in the following month for our next clue on how the FED will react in November during their next FOMC meeting.
How did this affect the U.S Dollar (DXY)?
💬 Bramwell’s Commentary & Analysis:
Remember that the DXY index symbolizes the strength of the U.S Dollar vs. a basket of currencies with the Euro as largest component of the index, making up 57.6% of the basket. The rest of the currencies in the index are JPY, GBP, CAD, SEK,CHF.
It’s important to differentiate between a strong U.S Dollar due to superb economic sentiment vs. a strong DXY due to the collapsing economies that make up the basket - and the truth is the latter.
The Euro, Canadian Dollar and British Pound are absolutely getting hammered causing the U.S Dollar to vacuum up all of the capital in the global markets, sending bond yields soaring to new highs and further exasperating the risk asset crisis of 2022.
🐂 Bramwell’s Prediction for the Week Ahead: 🚀 DXY Target of 115.5
📈 Featured Charts DXY 12-Hour & Monthly Timeframes
In the short term, I’m fully expecting the U.S Dollar to continue its strength upwards to the top of its channel ~115.5 (yellow circle) shown by this monthly timeframe chart below.

The 12-Hour Chart (below) I’ve shown two possible trajectories:

The Bad One (red path): U.S Dollar makes a short pit-stop at 115.5 before heading to Dot-Com bust era strength ~120. This would be the result of persistently high CPI data releases, black swan geopolitical tensions, increasing housing market pressure and/or poor corporate earnings releases from Q3.
The Good One (green path): The U.S Dollar experiences a sell-off at the top of it’s channel ~115 and begins it’s corrective pattern. This would be accompanied with favourable CPI data releases, anticipation of a power shift towards U.S elections, simmering of geopolitical tensions and/or currency intervention by foreign governments - aka. some good news for once.
This is why Treasuries are looking like real treasure.
Landlords ought to immediately sell their properties and buy treasuries instead to avoid the headache of property management and to avoid markdown on their capital valuation.
Let’s put this into perspective:
On a $500,000 rental property a landlord may charge $2500 for rent.
That is $2000 to cover the mortgage, $500 profit.
Annually, this would equate to $25,000 revenue (6%) and $6000 profit (1.2%)
Or, they can dump $500,000 into a 2-year treasury and net $20K for doing nothing - what would you do?
This is why I smell a housing market collapse on the horizon.
Let’s jump into the charts.
🐂 Bramwell’s Prediction for the Week Ahead: 10YR 🚀 4% | 2YR 🚀 4.75%
📈 Featured Charts US 10YR 12-Hour Timeframe / 2YR Daily Timeframe
The 10YR is pushing up towards 4% and I’m expecting a pullback into mid Q4 as the U.S elections should create volatility against the DXY.

Meanwhile, the US2YR is pushing up towards the July 2007 supply ~4.75% - 5% and unless the U.S wants to fully enter a panic recession, the 2YR better start showing weakness or the inverted yield curve is going to create a big problem.
I’m logically expecting a faster correction on the 2YR than the 10YR to accompany a rosier sentiment in the markets - but these days logic isn’t worth the font its typed on.

How does all of this affect the Stock Market (S&P500)?
💬 Bramwell’s Commentary & Analysis:
Here’s a short poem essay on the stock market.
Inflation is the byproduct of scorching hot demand.
To combat inflation, we slow down economic growth.
When we slow down economic growth, corporate earnings suffer.
When earnings suffer, investors sell stocks.
Stock market go down.
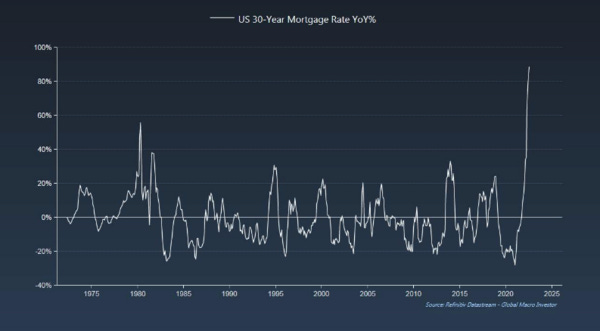
Amongst the many alarming signs that the U.S is headed for an economic recession, which would increase the selling pressure on U.S stocks, there are a few charts I want to show you that made me say “uh-oh, this really isn’t good.”
The first is the U.S 30-Year Mortgage rate that has skyrocketed over 90% YoY.
At the beginning of the year $2000 could have bought you a $500K home.
Now, $2000 buys you a $300K home.
What does this mean for the economy?
Home sales are declining as new home buyers are not entering the market.
Home builders are holding too much supply.
Consumer net worth is plummeting and with it the collateral against their credit lines that are becoming more expensive to finance.
The second chart is the U.S personal saving as a percentage of disposable income.
People are not working and there is a widespread labour shortage in the market.
Consumers are having to service more debt at a higher percentage of their income.
Less disposable income means less spending - reduced economic activity and lower corporate earning.
Potential defaults on consumer debt may lead to foreclosures in real estate.

We are walking a macroeconomic tightrope as we speak with inflation sizzling the pockets of consumers as they capitulate the only investments they own; mutual funds, stocks, crypto and or real estate, to cover their cash flow obligations.
All eyes on commodity prices, specifically energy prices and CPI data heading into Q3/Q4.
🧸 Bramwell’s Prediction for the Week Ahead:🔻 Target 3575-3600 + Bear Trap
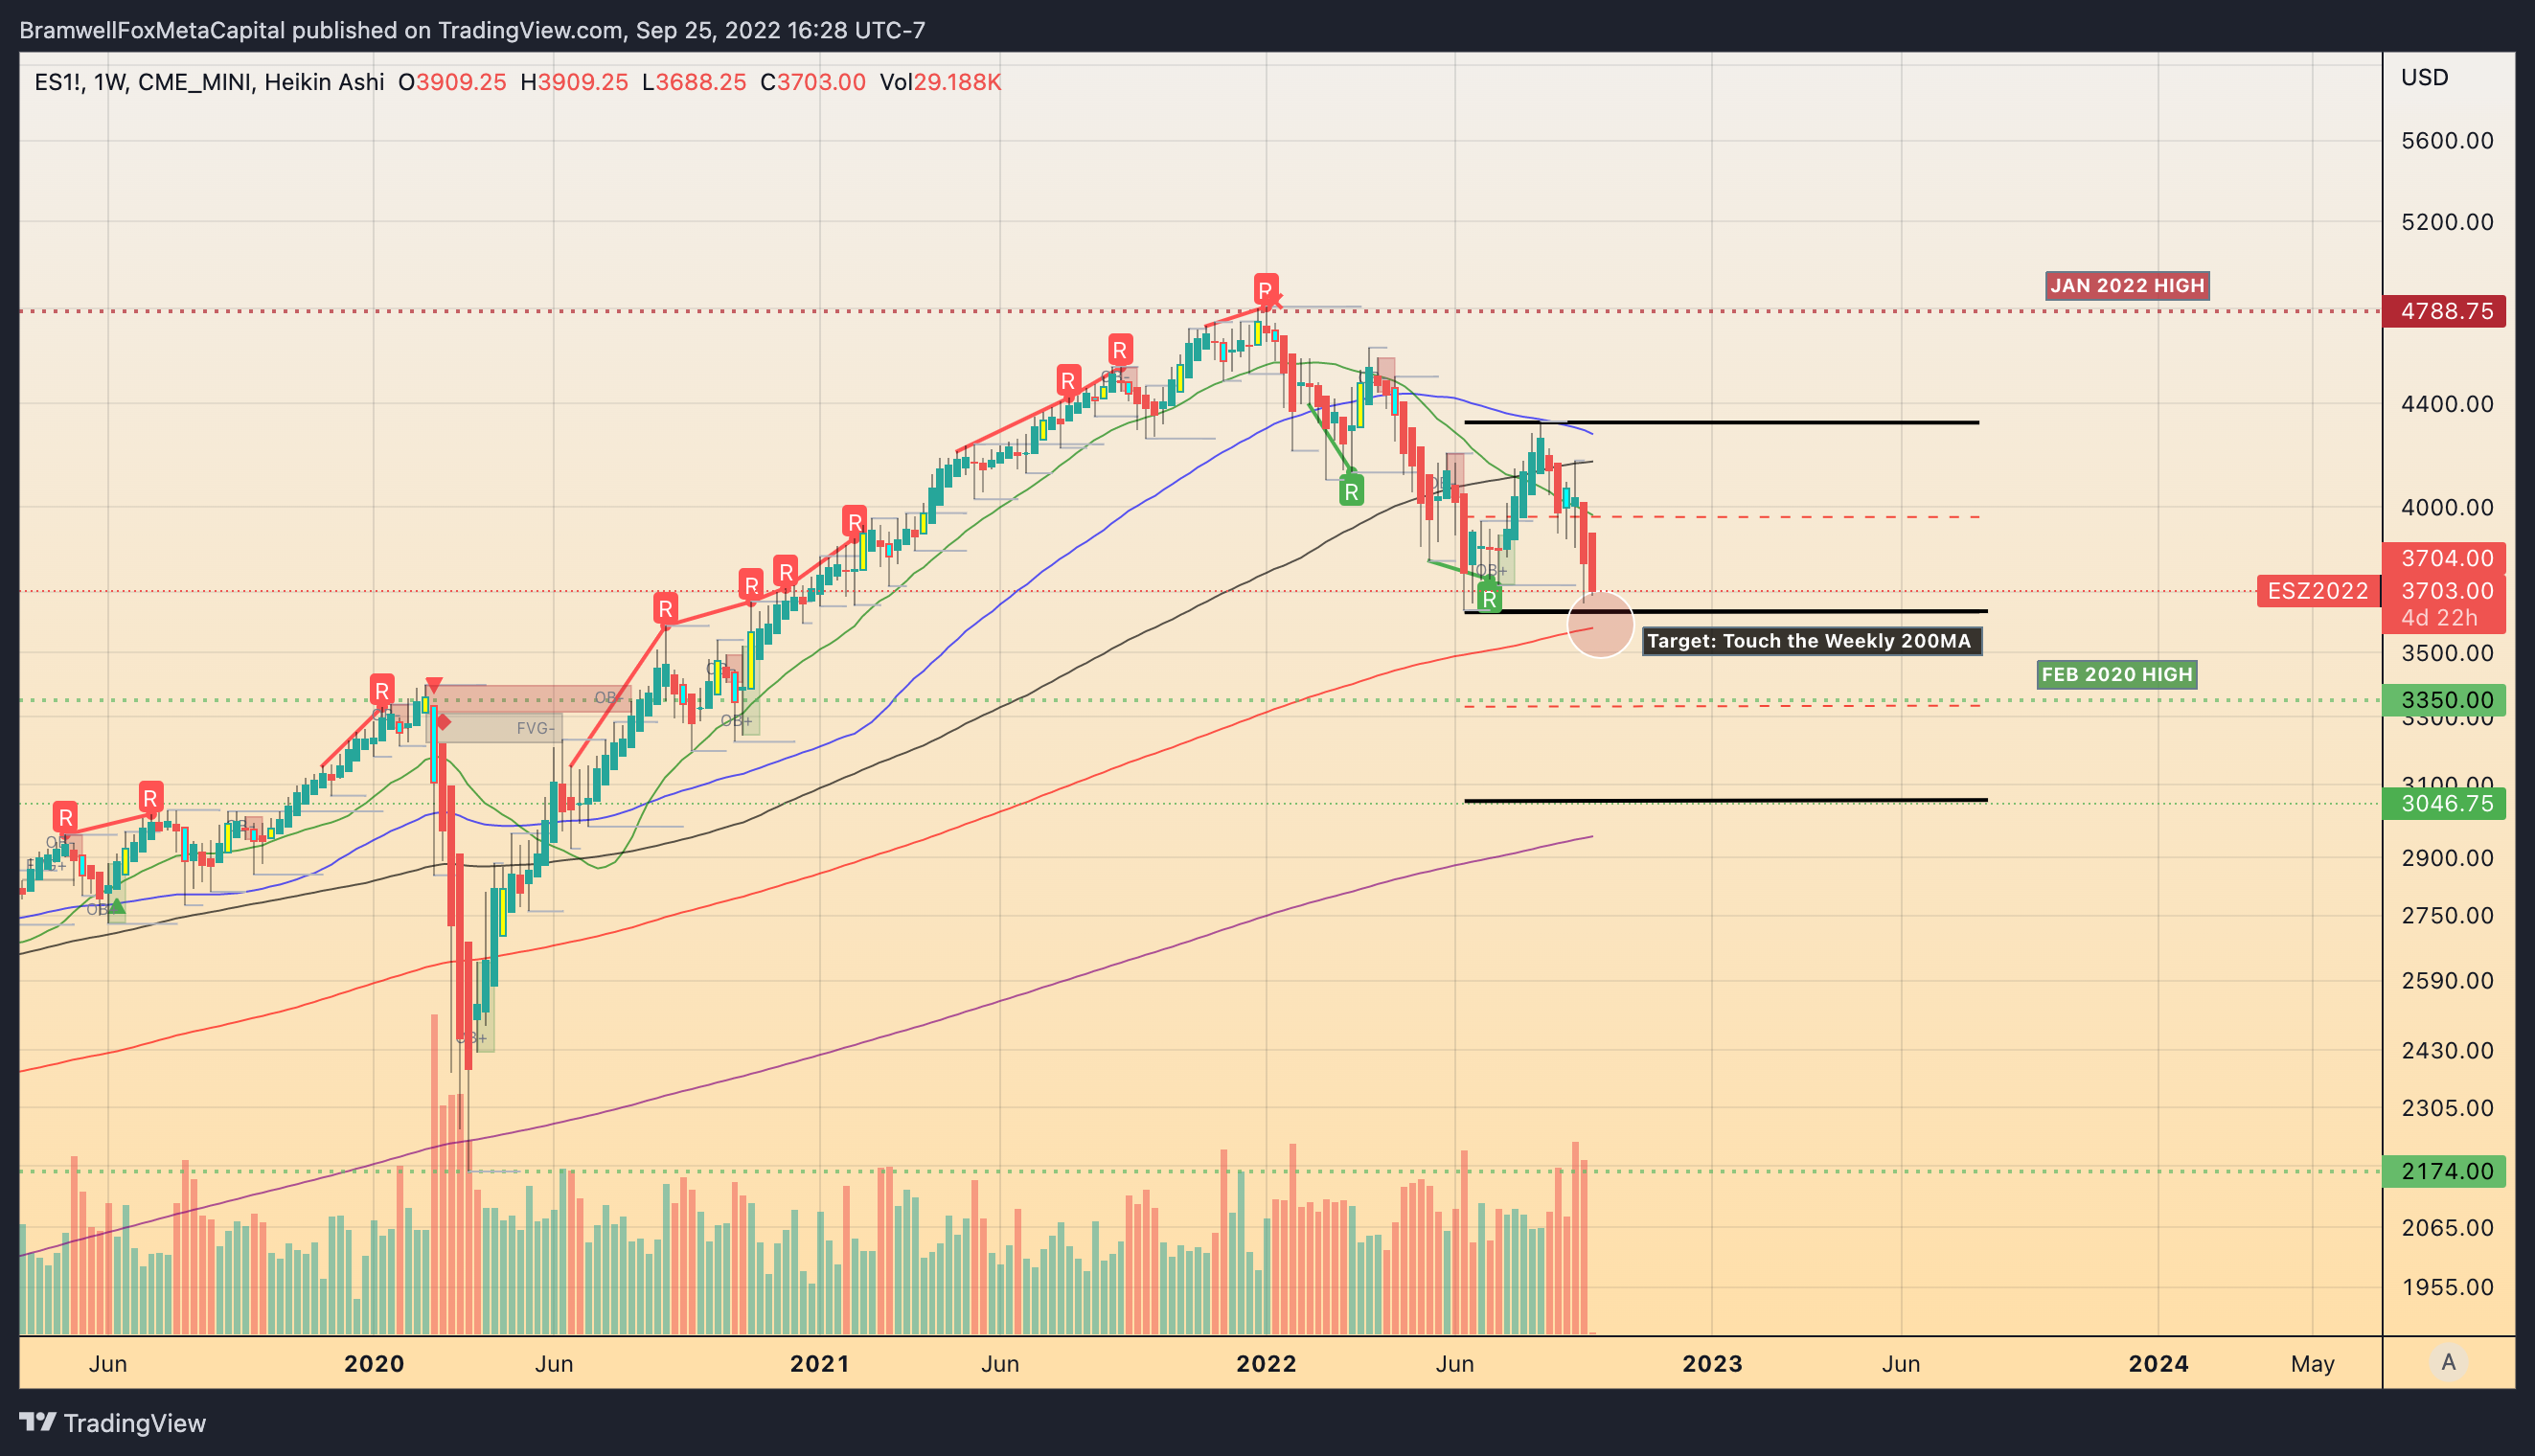
📉 Featured Charts S&P500 (Futures Markets) Weekly & 12-Hour Timeframes
In looking at the weekly timeframe S&P500 it’s clear that that since the lows of June (~3639) we’ve been trading in a range that is dangerously close to losing its support and falling through into the next standard deviation downwards.
If it were to fall, this would be the 15-20% drop the fear mongering guru’s had been predicting as the crash of all crashes with the next support coming from the February 2020 highs of ~3450.
I may regret saying this, but I’m not sold on the market taking this dive.
Much of the theory and education I’ve accumulated is leading me to take a contrarian stance on where the herd is looking.
Despite the weak macroeconomic outlook, the technicals of the S&P are showing a hint of hope.
The weekly 200 moving average is dangerously close to either:
a) being touched. 🤗
b) being broken. 🤡
Which leads me to my hypothesis that a bear trap could be forming on the S&P500 following a quick break of the horizontal support, a tap off the weekly 200 moving average and an impulse to the upside catching all of the short sellers and retail traders off guard.
In the 12-hour chart below, I’ve showcased what may be in store for us in the coming weeks.
It’s do or die time for U.S equities.

ps. As for markets up north, they look equally chilly.
📉 Featured Charts TSX Weekly & Daily Timeframe
The TSX is looking for a bottom somewhere in the ~18,000 with its own weekly 200MA close to be tested.
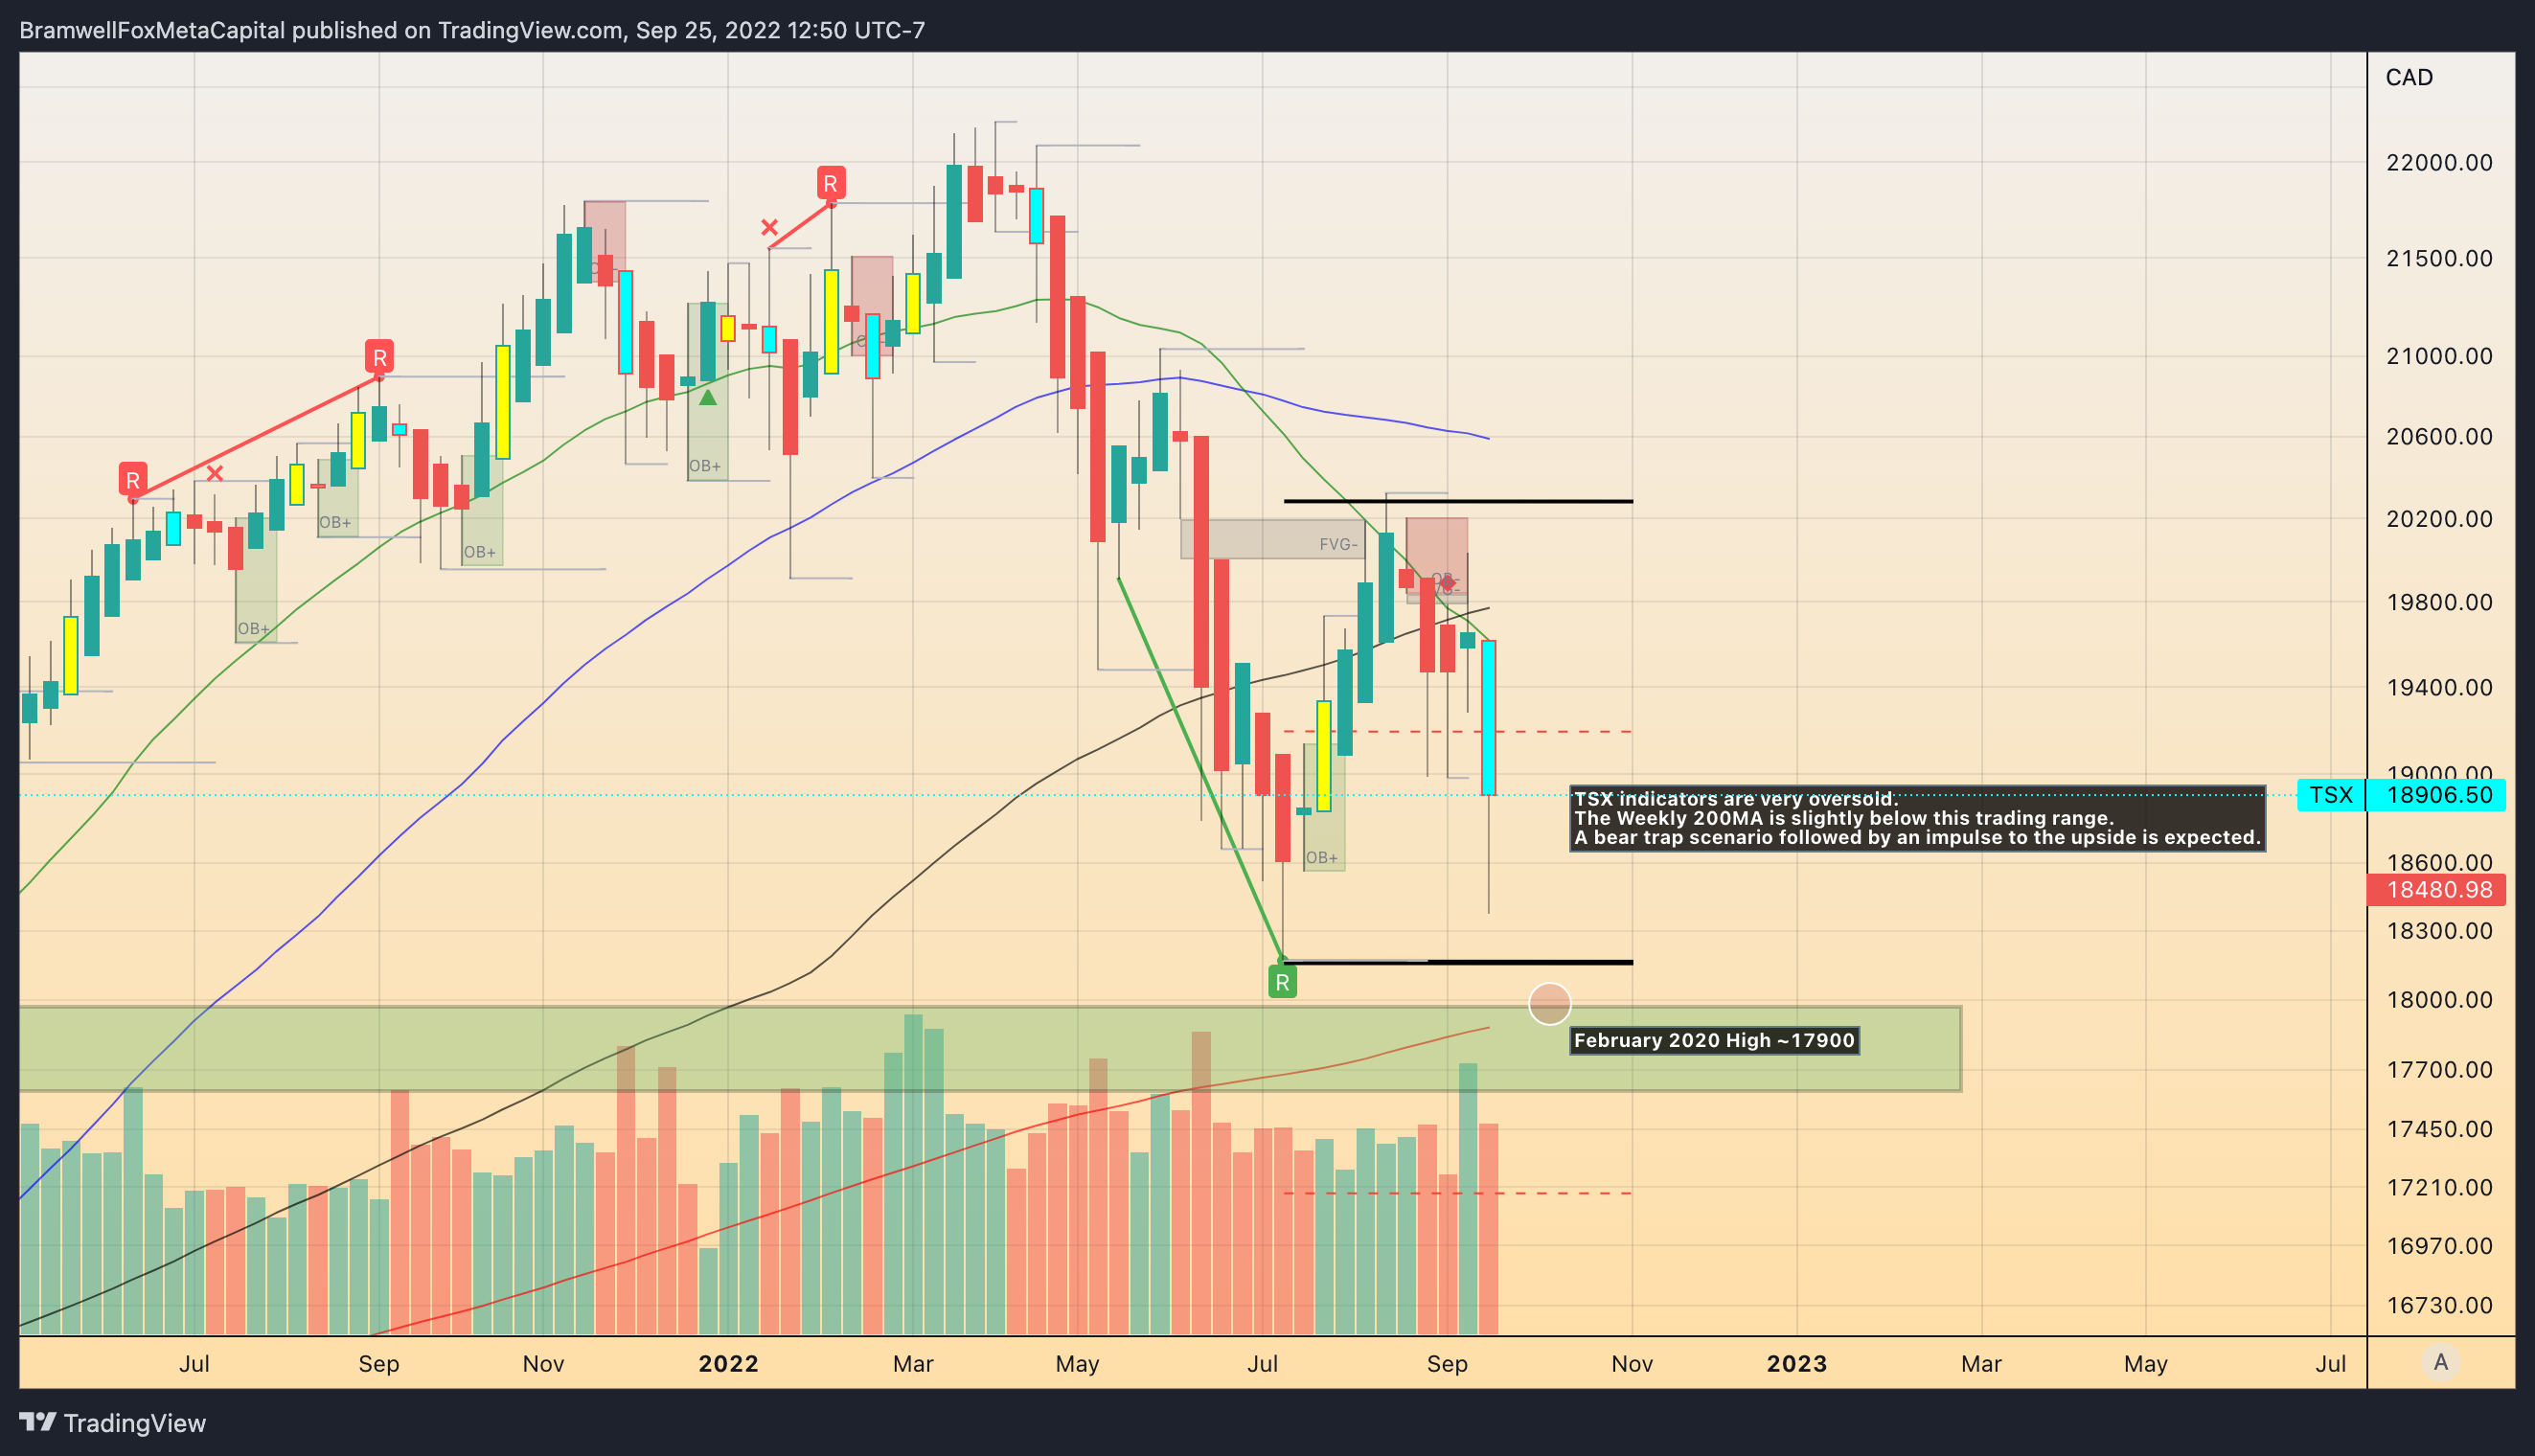
Zooming into the daily timeframe, this is the path I can see being taken with a short bear trap below support followed by a fundamentally driven news event to impulse the market into a rally by mid-October.

How will all of this affect the Cryptocurrency Markets?
🗞 CEO of Major Bank | Cryptos are “...decentralized Ponzi Schemes”
Jamie Dimon CEO of JP Morgan Chase testified in front of U.S congress last week
crying about how innovation will collapse his profitscalling all crypto’s ‘ponzi schemes’.
🗞 XRP Surges as Ripple vs. SEC Settlement Rumors Fly
CEO of Ripple Brad Garlinghouse made a number of mainstream media appearances last week touting a confident tone when asked about his sentiment of a case outcome vs. the Securities & Exchange Commission.
XRP is up 80% on the month as investors speculate on legal clarity for the one of the world’s most powerful blockchains.
🗞 U.S to ban algorithmic stablecoins?
The U.S government is set to vote on a potential multi-year ban on stablecoins featuring similar characteristics to the Terra Luna coin that near collapsed the crypto market earlier this year.
💬 Bramwell’s Commentary & Analysis:
I wouldn’t worry about Jamie Dimon.
At the same time that he’s calling crypto #ponzischemes, his banks near trillion dollar wealth management fund is investing into laying the foundation for their clients to have access to cryptocurrencies in their portfolios.
As for Ripple vs. SEC, the charts speak for themselves.
The XRP / BTC chart has broken through a multi-year resistance as investors are favouring the XRP token to be amongst the first to have market clarity in the digital asset space.
While it’s great to see XRP lead the crypto market in technical strength, the path forward still remains uncertain hinging on the movements of the U.S Dollar and exposed to any black swan events that may occur in Q4 2022.
Let’s jump into the charts.
BITCOIN
🧸 Bramwell’s Prediction for the Week Ahead: 🔻 Target 17.6K - 18K + Bear Trap
📉 Featured Charts BTC Daily & 4-Hour Timeframes
I’m really hedging on this contrarian play across the worlds most lucrative markets, equities and crypto.
Bitcoin has already been in a near 18 month correction, those who were going to capitulate have likely done so including the wiping out of most over-leveraged traders and funds.
The remaining price action in my opinion will be dictated by the movement of the U.S dollar to trigger algorithmic trading bots to further liquidate any longs placed at the June lows of 17.6K.
This move down has the potential to create a bear trap for eager short sellers who were expecting prices to fall into the 13K-15K range (red path) and front running their bids back upwards into a BTC reversal (green path).
Should Bitcoin not bounce if it falls to the ~18K region, it’s very possible a collapse into that 15.5K region may occur taking the rest of the crypto market with it.

Zooming into the 4-Hour you can see with more detail the possible trajectories I’ve mapped.

XRP
🧸 Bramwell’s Prediction for the Week Ahead: 🔻 Target .40-.42c
📉 Featured Charts XRP Monthly & Daily Timeframes
There’s a certain energy in the air as an XRP #hodlr, can you feel it?
First let’s start with the monthly timeframe.
In 2018, XRP had it’s historic impulse up to $3.84 leaving the previous all time high price with no firm re-test.
In 2020 during the March 2020 lows, XRP fell to .10c before it’s most recent bull run up to the $2 range in Spring 2021.
This leaves a few possibilities from here:
a) XRP has now re-tested the bottom of its current trading range and is primed for a surge upwards marked by the green arrow. This is the scenario to which I give the highest probability.
b) XRP breaks its current support leaving room for it to fall anywhere from .30c all the way down to the 2c - 3c range. Unless there is an absolute monster of an economic collapse or black swan, I do not have too much faith in this doomsday scenario.

Zooming into the 12-Hour timeframe we can see how powerful the last move upwards truly was for XRP.
From it’s current price ~.50c, I can see two scenarios:
a) A short squeeze into the .60c range to punish the bears.
b) A healthy correction back down into the 40c - 42.5c range.
Scenario B corresponds with my outlook across other markets and their correlational movement with each other.
Buy the dip.

How about gas prices? Let’s dive into Oil.
Crude Oil
🗞 Putin is not ‘putin’ up with anymore 💩
Putin appears to be increasing his aggression towards Ukraine heading into Winter.
This could have very bad effects on the global energy market, especially Europe and any events must be monitored closely.
🧸 Bramwell’s Prediction for the Week Ahead: 🔻 Target $70 - $75
📉 Featured Chart Oil Daily Timeframe
My outlook on Oil has not changed.
While I’m carefully watching the news events unfold that may interrupt global supply chains, the technicals appear to confirm a further downside for Oil into the $70-$75 range.

What about Fools Gold?
Gold
🧸 Bramwell’s Prediction for the Week Ahead: Short Term🔻 Target $1600
📉 Featured Chart Gold Weekly Timeframe
It’s hard to imagine that every single chart in the financial markets is looking bearish - isn’t it?
Something has to be fooling us - is it Gold?
I’ve been bullish on gold as it remained in a multiyear trading channel and maintained bullish structure the entire time - all while inflation ran wild.
Recently, Gold appears to have lost it’s 200MA support which could mean a breakdown into the next range targeting the lows of March 2020 with a price of ~1550 per oz.
It’s worth noting that Gold is a highly manipulated asset.
With the demise of nearly all global currencies, the typical investment play is to run to the hardest money on earth, Gold.
Could this be a whale manipulated slight of hand on Gold prices, trapping short sellers?
Time will tell - for now these two possible paths could be considered.

👋🏼 Hey!
Thanks for reading this week's edition of the Weekly Recap + Looking Ahead.
If you have any comments, feedback or questions on any material written in this edition please share as I'd love to continue a dialogue below.
If you enjoyed the read, share it with your network of friends, family & fellow investors.